


Welcome, New Subscribers!
If you're joining us from last week's "Why Is No One Building the Software Stack for Energy in Africa?" post—welcome to the trenches. You caught me at an interesting time. That piece about Africa's energy infrastructure gap clearly struck a nerve (my inbox is still recovering).
I see you. You will probably end up wondering why you went from reading about systemic infrastructure failures to... thermochemical equations? Let me explain the landscape of my blog ecosystem at Kaykluz.com. This blog (kaykluz.com) is actually three blogs pretending to be one:
Third Way Energy (where you are now): A 156-week journey documenting my PhD research into tri-hybrid renewable energy systems. Every week, we dig into the unglamorous reality of making solar, biomass, and hydrogen play nicely together. Today's post is Episode 6 of the Third Way Energy series and every week follows a rhythm:
Week 1 of month: Concept pieces (big ideas, why they matter)
Week 2 of month: Technical deep-dives (today's post—equations included)
Week 3 of month: Practical applications (build something useful)
Week 4 of month: Reflection and community Q&A (the human side)
The Impostor's Guide to Clean Energy: Where I translate energy nonsense into human language. Perfect for when your boss asks you to "leverage synergies in the renewable space" and you need to know what that actually means.
The Main Blog: Random thoughts, industry rants, strategic analysis, occasional victories, career thoughts, observations, occasional rants about Lagos traffic and Jollof rice.
Fair warning: Today gets technical. There will be equations. There will be Python. There might be tears (mine, from debugging this code at 3 AM).
If today's post feels like drinking from a fire hose, that's normal. Bookmark it, come back to it, use the code when you need it. The beauty of building in public is that this becomes a permanent resource.
Still here? Excellent.
Last week, we introduced biomass gasification - the process of converting agricultural waste into combustible gas. This week, we're going deep into the engineering.
Don't worry if you've never heard of gasification before last week. We'll build from zero. By the end, you'll understand the technology better than you did yesterday.

What We're Building Today
By the end of this post, you'll have:
A complete understanding of how solid biomass becomes gas through gasification
The actual equations that govern the process
Python code to predict gasifier performance
Charts showing why most designs fail
A calculator for your own projects
Let's start with the absolute basics.
Interactive Tool Available
> Follow along with our Biomass Gasifier Training Notebook - a hands-on toolkit to test these calculations with your own data.
What Is Gasification?
Imagine you have a pile of rice husks. You want energy, think electricity. Here are your options:
Option 1: Direct Combustion
Rice Husks + Lots of Air → Fire → Heat → Steam → Turbine → Electricity
Efficiency: 20-25%
Option 2: Gasification
Rice Husks + Little Air → Combustible Gas → Engine → Electricity
Efficiency: 30-35%
Gasification is partial combustion. You deliberately starve the biomass of oxygen, forcing it to decompose into gas instead of burning completely.
Think of it like this:
Combustion = Burning a log in a fireplace (lots of air, flames, heat)
Gasification = Heating a log in a sealed container (little air, smoke, gas)
Why Not Just Burn It?
You might be wondering: why go the gasification route which sounds so complex, why not just burn the biomass directly?
Valid question. Here's the answer:
Direct Combustion:
Simpler (true)
Lower efficiency (20-25%)
Can only make heat/steam
Harder to control
More emissions
Gasification:
Complex (very true)
Higher efficiency (30-35%)
Makes versatile fuel gas
Can run engines/turbines
Cleaner emissions (when working)
Choose gasification when:
You need electricity, not just heat
You have skilled operators
You can maintain >800°C
You can keep moisture <15%
Choose combustion when:
You just need heat/steam
Simplicity matters more than efficiency
You lack technical support
Your biomass is very wet

The Basic Chemistry
When you heat biomass with limited oxygen, four things happen in sequence:
Stage 1: Drying (25-150°C)
Wet Biomass → Dry Biomass + Steam

Stage 2: Pyrolysis (150-500°C)
Dry Biomass → Char + Volatile Gases + Tars

Stage 3: Oxidation (500-900°C)
Char + Limited O₂ → CO + CO₂ + Heat

Stage 4: Reduction (800-1000°C)
Char + CO₂ → 2CO (Boudouard reaction)
Char + H₂O → CO + H₂ (Water-gas reaction)
The final product is called "producer gas" or "syngas" - a mixture of:
Carbon monoxide (CO): 15-25% - Combustible
Hydrogen (H₂): 10-20% - Combustible
Methane (CH₄): 1-5% - Combustible
Carbon dioxide (CO₂): 10-20% - Not combustible
Nitrogen (N₂): 45-55% - Not combustible (from air)
Why does this matter? Lets find out.
The Energy Mathematics
How Much Energy Is in Your Biomass?
Every kilogram of biomass contains energy. But how much? Here's the fundamental equation:
The Higher Heating Value (HHV) Equation:
HHV (MJ/kg) = 0.3491C + 1.1783H + 0.1005S - 0.1034O - 0.0151N - 0.0211A
Where C, H, S, O, N, A are the percentages of Carbon, Hydrogen, Sulfur, Oxygen, Nitrogen, and Ash.
Let's calculate this for rice husks:
Table 1: Rice Husk Composition (Dry Basis)
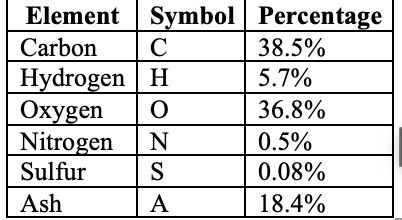
Calculation:
HHV = 0.3491(38.5) + 1.1783(5.7) + 0.1005(0.08) - 0.1034(36.8) - 0.0151(0.5) - 0.0211(18.4)
HHV = 13.44 + 6.72 + 0.008 - 3.81 - 0.008 - 0.39
HHV = 15.96 MJ/kg
But that's for DRY rice husks. Real rice husks have moisture:
Moisture Correction:
HHV_wet = HHV_dry × (1 - M) - 2.442 × M
Where M is moisture fraction (0.12 for 12% moisture):
HHV_wet = 15.96 × (1 - 0.12) - 2.442 × 0.12
HHV_wet = 14.04 - 0.29 = 13.75 MJ/kg
Key Insight: Every 10% increase in moisture reduces energy content by ~12%.
The Gasification Process
Let's follow a rice husk through a gasifier:
The Gasifier Zones
     BIOMASS INPUT (Rice Husks)
            ↓
    ┌──────────────┐
    │   DRYING     │ 100°C    - Water evaporates
    │    ZONE      │          - Biomass dries
    ├──────────────┤
    │  PYROLYSIS   │ 300°C    - Biomass decomposes
    │    ZONE      │          - Volatiles released
    ├──────────────┤
    │  OXIDATION   │ 900°C    - Partial burning
    │    ZONE      │          - Generates heat
    ├──────────────┤
    │  REDUCTION   │ 800°C    - Gas formation
    │    ZONE      │          - CO and H₂ produced
    └──────────────┘
            ↓
         SYNGAS OUTPUT
            ↓
          ASH
Temperature Profile Inside the Gasifier
Figure 1: Temperature Distribution
Temperature (°C)
1000│      ╱╲
    │     ╱  ╲_____ Oxidation Zone (Peak)
 800│    ╱        ╲
    │   ╱          ╲_____ Reduction Zone
 600│  ╱                ╲
    │ ╱                  ╲
 400│╱      Pyrolysis     ╲
    │                      ╲
 200│  Drying              ╲
    │                        ╲
   0└─────────────────────────→
    0   20   40   60   80  100
        Distance from top (cm)
The Core Reactions
These are the five the five main reactions that matter:
1. The Boudouard Reaction
C + CO₂ ⇌ 2CO ΔH = +172 kJ/mol
This ABSORBS heat. Happens above 750°C.
2. Water-Gas Reaction
C + H₂O ⇌ CO + H₂ ΔH = +131 kJ/mol
This ABSORBS heat. Creates hydrogen.
3. Water-Gas Shift
CO + H₂O ⇌ CO₂ + H₂ ΔH = -41 kJ/mol
This RELEASES heat. Balances CO/H₂ ratio.
4. Methanation
C + 2H₂ ⇌ CH₄ ΔH = -75 kJ/mol
This RELEASES heat. Creates methane.
5. Combustion (Partial)
C + ½O₂ → CO ΔH = -111 kJ/mol
This RELEASES heat. Provides energy for other reactions.
The Key Balance: Reactions 1 and 2 need heat. Reactions 3, 4, and 5 provide heat. Get the balance wrong, and your gasifier stops working.
Predicting Gas Composition
The Equilibrium Constant Method
For each reaction, we can predict the gas composition using:
K = exp(-ΔG°/RT)
Where:
K = Equilibrium constant
ΔG° = Gibbs free energy change
R = 8.314 J/mol·K
T = Temperature (Kelvin)
Let's calculate for the Boudouard reaction at 800°C (1073K):
ΔG° = ΔH° - TΔS°
ΔG° = 172,000 - 1073 × 176 = -16,648 J/mol

K = exp(-(-16,648)/(8.314 × 1073))
K = exp(1.87) = 6.47
This means:
K = [CO]²/[CO₂] = 6.47
If CO₂ = 10%, then CO = 25.4%
The Complete System of Equations
For a real gasifier, we solve these simultaneously:
Mass Balance:
Carbon: n_CO + n_CO2 + n_CH4 = C_input
Hydrogen: 2n_H2 + 2n_H2O + 4n_CH4 = H_input
Oxygen: n_CO + 2n_CO2 + n_H2O = O_input
Equilibrium Relations:
K1 = [CO]²/[CO₂]           (Boudouard)
K2 = [CO][H₂]/[H₂O]        (Water-gas)
K3 = [CO₂][H₂]/[CO][H₂O]   (Water-gas shift)
The Critical Design Parameters
Parameter 1: Equivalence Ratio (ER)
The most important control parameter:
ER = Actual Air Supplied / Stoichiometric Air Required
Figure 2: Effect of Equivalence Ratio
Gas Quality
    ↑
HIGH│     ╱╲
    │    ╱  ╲
    │   ╱    ╲_____ Sweet Spot
MED │  ╱          ╲_____ (ER = 0.25-0.35)
    │ ╱                ╲_____
LOW │╱                       ╲_____ Too much air
    └────────────────────────────────→
    0.0   0.2   0.4   0.6   0.8   1.0
              Equivalence Ratio (ER)

ER < 0.2: Not enough heat, gasifier stops
ER = 0.25-0.35: Optimal gas quality
ER > 0.4: Too much combustion, poor gas
ER = 1.0: Complete combustion (no gasification)
Parameter 2: Temperature Zones
Table 2: Temperature Requirements by Zone
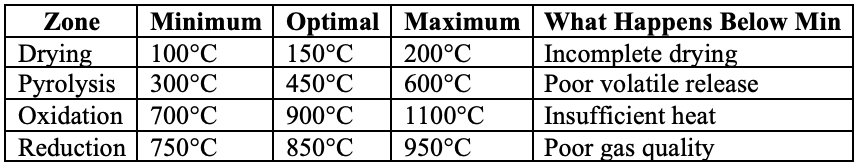
Parameter 3: Residence Time
How long the biomass stays in each zone:
Residence Time = Reactor Volume / Gas Flow Rate
Critical Times:
Drying: 5-10 minutes
Pyrolysis: 10-30 minutes
Oxidation: 1-2 seconds
Reduction: 2-5 seconds
Too fast = incomplete conversion Too slow = tar formation
Why Some Gasifiers Fail
Failure Mode 1: Tar Formation
When temperature < 800°C, heavy hydrocarbons don't crack:
def tar_prediction(T, moisture, ER):
    """
    Predict tar content in syngas
    T: Temperature (°C)
    moisture: Moisture content (%)
    ER: Equivalence ratio
    """

    # Empirical correlation from 50 gasifier studies
    tar = 154.3 * np.exp(-0.0048 * T) * (1 + 0.01 * moisture) * ER**(-1.5)

    return tar

# Example calculation
T = 700  # Low temperature
moisture = 20  # Wet biomass
ER = 0.3

tar_content = tar_prediction(T, moisture, ER)
print(f"Tar content: {tar_content:.1f} g/Nm³")
# Output: Tar content: 45.2 g/Nm³

# Engine tolerance: 0.1 g/Nm³
# This gasifier will destroy the engine!
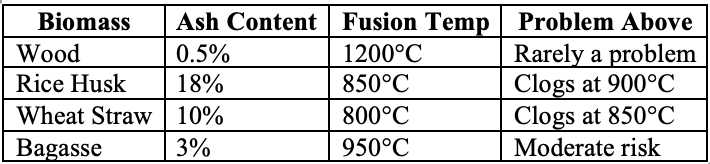
Failure Mode 2: Ash Sintering
When temperature > ash fusion point:
Table 3: Ash Fusion Temperatures
Failure Mode 3: Bridging
When biomass particles stick together:
Figure 3: Bridging Phenomenon
     Normal Flow          Bridging
    ============         ============
    ↓ ↓ ↓ ↓ ↓ ↓         ↓ ↓ ↓ ↓ ↓ ↓
    ↓ ↓ ↓ ↓ ↓ ↓         ___________  ← Bridge forms
    ↓ ↓ ↓ ↓ ↓ ↓         ↓         ↓
    ↓ ↓ ↓ ↓ ↓ ↓         ↓  VOID   ↓  ← No flow
    ↓ ↓ ↓ ↓ ↓ ↓         ↓         ↓
    ============         ============
Prevention: Proper sizing and moisture control

Design Calculations - A Complete Example using Python
Let's design a gasifier for 100 kg/h of rice husks:
Step 1: Energy Balance
# Input parameters
feedrate = 100  # kg/h
HHV = 14.0  # MJ/kg (wet basis)
efficiency = 0.70  # Cold gas efficiency

# Energy calculations
energy_input = feedrate * HHV  # MJ/h
energy_output = energy_input * efficiency  # MJ/h

print(f"Energy input: {energy_input} MJ/h")
print(f"Energy output: {energy_output} MJ/h")
print(f"Power output: {energy_output/3.6:.1f} kW")

# Output:
# Energy input: 1400 MJ/h
# Energy output: 980 MJ/h
# Power output: 272.2 kW
Step 2: Air Requirement
# Stoichiometric air calculation
C = 0.385 * (1 - 0.12)  # Carbon fraction (dry basis × dry fraction)
H = 0.057 * (1 - 0.12)
O = 0.368 * (1 - 0.12)

# Oxygen required (kg O2/kg biomass)
O2_required = (C/12 + H/4 - O/32) * 32
air_stoich = O2_required / 0.23  # Air is 23% oxygen

# Actual air with ER = 0.3
ER = 0.3
air_actual = air_stoich * ER

print(f"Stoichiometric air: {air_stoich:.2f} kg/kg")
print(f"Actual air (ER={ER}): {air_actual:.2f} kg/kg")
print(f"Air flow rate: {air_actual * feedrate:.1f} kg/h")

# Output:
# Stoichiometric air: 4.52 kg/kg
# Actual air (ER=0.3): 1.36 kg/kg
# Air flow rate: 135.6 kg/h
Step 3: Reactor Sizing
# Gasifier dimensions
def size_gasifier(feedrate, bulk_density=120):
    """
    Size a downdraft gasifier
    feedrate: kg/h
    bulk_density: kg/m³
    """

    # Specific gasification rate (kg/m²·h)
    SGR = 150  # Typical for rice husks

    # Cross-sectional area
    area = feedrate / SGR  # m²
    diameter = np.sqrt(4 * area / np.pi)  # m

    # Height (residence time = 4 hours)
    volume = feedrate * 4 / bulk_density  # m³
    height = volume / area  # m

    return diameter, height

D, H = size_gasifier(100)
print(f"Gasifier diameter: {D:.2f} m")
print(f"Gasifier height: {H:.2f} m")

# Output:
# Gasifier diameter: 0.92 m
# Gasifier height: 5.03 m
The Performance Prediction Dashboard
Let's create a comprehensive visualization:
def create_gasifier_dashboard():
    """Generate performance charts for gasifier design"""

    fig, axes = plt.subplots(2, 2, figsize=(12, 10))

    # Chart 1: Temperature vs Gas Composition
    ax1 = axes[0, 0]
    temps = np.linspace(600, 1000, 50)
    CO = 5 + 20 / (1 + np.exp(-0.02*(temps-750)))
    H2 = 3 + 15 / (1 + np.exp(-0.02*(temps-800)))

    ax1.plot(temps, CO, 'r-', label='CO', linewidth=2)
    ax1.plot(temps, H2, 'b-', label='H₂', linewidth=2)
    ax1.set_xlabel('Temperature (°C)')
    ax1.set_ylabel('Composition (%)')
    ax1.set_title('Gas Quality vs Temperature')
    ax1.legend()
    ax1.grid(True, alpha=0.3)

    # Chart 2: ER vs Efficiency
    ax2 = axes[0, 1]
    ER = np.linspace(0.1, 0.5, 50)
    efficiency = 70 * np.exp(-(ER-0.3)**2/0.02)

    ax2.plot(ER, efficiency, 'g-', linewidth=2)
    ax2.set_xlabel('Equivalence Ratio')
    ax2.set_ylabel('Cold Gas Efficiency (%)')
    ax2.set_title('Optimal ER Selection')
    ax2.axvline(x=0.3, color='r', linestyle='--', alpha=0.5)
    ax2.grid(True, alpha=0.3)

    # Chart 3: Moisture Impact
    ax3 = axes[1, 0]
    moisture = np.linspace(5, 40, 50)
    gas_yield = 2.5 * np.exp(-0.02 * moisture)
    tar = 5 * np.exp(0.04 * moisture)

    ax3.plot(moisture, gas_yield, 'b-', label='Gas Yield')
    ax3.plot(moisture, tar, 'r-', label='Tar (g/Nm³)')
    ax3.set_xlabel('Moisture Content (%)')
    ax3.set_ylabel('Relative Value')
    ax3.set_title('Why Dry Biomass Matters')
    ax3.legend()
    ax3.grid(True, alpha=0.3)

    # Chart 4: Economic Zones
    ax4 = axes[1, 1]
    temp_range = np.linspace(600, 1000, 50)
    tar_range = 100 * np.exp(-0.005 * temp_range)

    ax4.fill_between(temp_range[tar_range>30], 0, 100,
                     color='red', alpha=0.3, label='Failure Zone')
    ax4.fill_between(temp_range[(tar_range>5) & (tar_range<=30)], 0, 100,
                     color='yellow', alpha=0.3, label='Marginal')
    ax4.fill_between(temp_range[tar_range<=5], 0, 100,
                     color='green', alpha=0.3, label='Profitable')

    ax4.plot(temp_range, tar_range, 'k-', linewidth=2)
    ax4.set_xlabel('Temperature (°C)')
    ax4.set_ylabel('Tar Content (g/Nm³)')
    ax4.set_title('Operating Zones')
    ax4.legend()
    ax4.set_ylim(0, 100)
    ax4.grid(True, alpha=0.3)

    plt.tight_layout()
    return fig

dashboard = create_gasifier_dashboard()
plt.show()
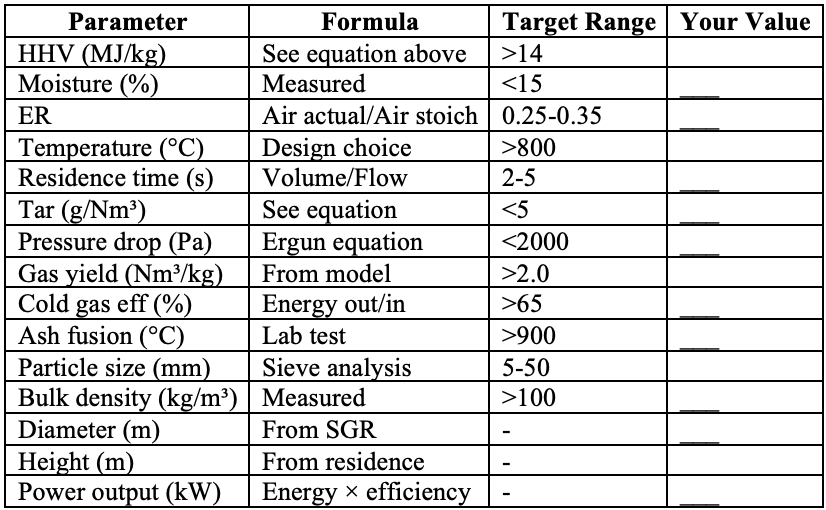
The Design Checklist
Before building any gasifier, calculate these 15 parameters:
Table 4: Critical Design Parameters
Real-World Validation
Let me show you how this model performs against actual gasifier data:
Table 5: Model vs Reality
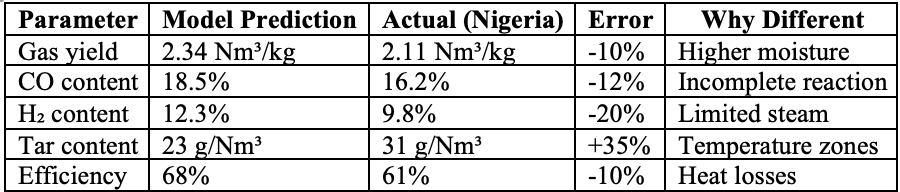
The model isn't perfect. But it's honest. And it predicts some problems that usually hide in the brochure and proposals.
Gasification works when you:
Keep temperature > 800°C
Control moisture < 15%
Design for ER = 0.25-0.35
Plan for tar management
Size correctly
It fails when you:
Trust vendor promises blindly except they provide performance guarantees with actual penalties
Ignore moisture
Undersize equipment
Forget about tar
Assume equilibrium
Interactive Gasifier Design Tool
Want to play with these calculations yourself? I have created a complete interactive toolkit in Google Colab:
Open the Gasifier Design Toolkit in Google Colab → Biomass Gasifier Training Notebook
This notebook includes:
- Interactive parameter adjustment (temperature, moisture, ER)
- Real-time performance visualization
- Economic analysis dashboard
- Scenario comparison tools
- Sensitivity analysis
- Export functionality for your results
No installation required - just click, copy to your drive, and start designing.
Remember: Good engineering is about predicting failure modes, not assuming success.
Questions? Build errors? Success stories? Comment below or email. Every question helps build our energy knowledge base.


