
The Bankability Myth
Why "There Are No Bankable Projects" Is the Wrong Diagnosis for Africa's Energy Crisis

I have been in enough conference rooms to recognize a certain phrase when it floats by. Usually spoken by someone in a nice suit, usually with a slight shrug, usually as the conversation-ender that everyone nods along to:
“The problem isn’t capital. There are no bankable projects.”
I have heard it from DFI representatives. I have heard it from fund managers. I have heard it from government officials who probably heard it from the DFI representatives. It has the comfortable ring of a diagnosis that absolves everyone of responsibility. It has a certain elegance to it. Sounds technical. Sounds rigorous. Most importantly, it shifts blame to an abstract quality problem rather than a systemic infrastructure failure.
The money is there, you see. It’s just that those Africans haven’t produced anything worth funding.
And for a long time, I half-believed it. Maybe we really didn’t have our act together. Maybe the projects really were substandard. Maybe “bankability” was some objective threshold we simply hadn’t learned to cross. Maybe African energy projects really were substandard.
Then I started pulling the data. I spent the last few months synthesizing evidence from the IEA, World Bank, McKinsey, AfDB, GEAPP, RMI, and about 180 other sources. I built conversion funnels. I mapped friction points across six energy sectors and eleven countries. I talked to developers who had watched projects die in the gauntlet.
And what I found tells a completely different story.
The Numbers Don’t Add Up
Let me lay out the contradiction that should make anyone suspicious of the “no bankable projects” narrative.
Sub-Saharan Africa faces an energy access gap of staggering proportions. I am drawing here from IEA 2024 data and World Bank 2023 figures:
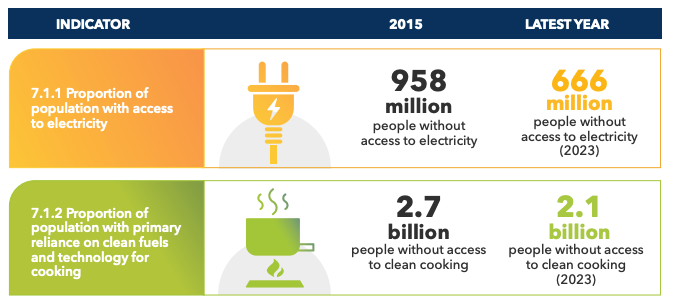
666 million people lack access to electricity. That’s 42% of the sub-Saharan population. Another 500 million have access to unreliable, low-quality electricity that cuts out for hours every day.
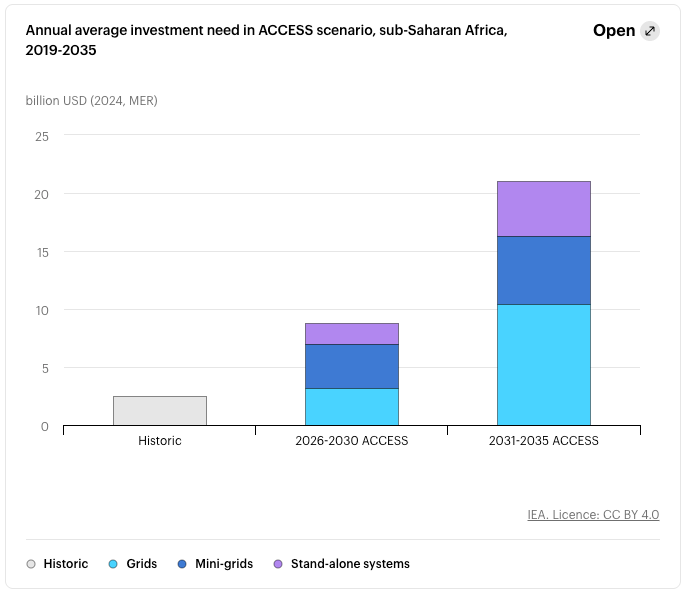
The IEA calculates that universal access by 2035 requires approximately $15 billion annually. Actual deployment in 2023? $2.5 billion.
That’s an 83% funding gap. On the surface, it screams capital scarcity.
But here’s where it gets strange.
In April 2024, the World Bank, African Development Bank and a coalition of partners launched Mission 300, targeting 300 million electricity connections by 2030. The commitments rolled in fast. World Bank pledged $25-40 billion (increased from initial $25-30 billion at the January 2025 Africa Energy Summit). AfDB pledged $10-18 billion (up from an initial $5 billion to $18.2 billion at the 2025 summit). Bilateral partners added billions more. Total committed capital: somewhere between $30-90 billion depending on how you count private sector mobilization targets.
And as of September 2024? Actually deployed capital stood at $7.9 billion. That’s an 8.8% deployment rate. Meaning $22-82 billion sits idle despite 666 million people waiting in the dark.
I kept staring at these numbers. If the problem were truly “no bankable projects,” if capital were simply looking for good deals and finding none, we’d expect committed funds to chase those deals aggressively. Instead, committed funds are sitting still while DFI officers repeat the phrase that explains away their underperformance.
Something doesn’t fit.
If capital scarcity were the problem, deployment would accelerate proportionally with commitments. It hasn't. The implied annual deployment rate is approximately $2.6 billion, while the pace required to hit the 2030 target is $13.3 billion annually.
The gap between “committed” and “deployed” reveals something that the “no bankable projects” crowd doesn’t want to talk about:
The bottleneck truly isn’t money. The bottleneck is everything that happens before the money can flow.
The Scale of What We’re Talking About
Before I go further, let me ground this in the human reality.
Of the 666 million people without electricity access in sub-Saharan Africa, 80% live in rural areas (IEA, 2024b). Energy poverty correlates tightly with extreme poverty: of the 738 million people in extreme poverty globally, 430 million (58%) live in sub-Saharan Africa (World Bank, 2024b). The population requiring electricity access will only grow, with 40% of global population growth occurring in Africa through 2050 (UN, 2023).
The development consequences are cascading. Countries with less than 50% electrification have average life expectancies 8-10 years lower than those with greater than 90% electrification. Healthcare facilities cannot maintain cold chains for vaccines. Schools cannot support distance learning. Small businesses cannot operate refrigeration or electric tools (IEA, 2022).
And here’s the cruel irony: Sub-Saharan Africa possesses exceptional renewable energy resources. The region has solar potential of 1,700-2,200 kWh/m²/year across most regions, compared to 1,100-1,400 kWh/m² globally (IRENA, 2024). Wind potential in the SADC region alone requires 52.8GW for universal access through 2040, yet only 1% is currently tapped (Boston University Global Development Policy Center, 2024). Hydropower technical feasibility stands at 310GW; only 74GW is currently developed (AfDB, 2024).
Yet solar and wind installations comprised only 12% of sub-Saharan Africa’s generation capacity as of 2023, despite global renewables reaching 42% (IEA, 2024b).
The resources are there. The need is desperate. The capital is committed. And still, 83% of required funding fails to deploy.
What “Bankable” Actually Means
Let me define this term that gets tossed around like everyone understands it.
A project is “bankable” when it has accumulated enough documentation, data, and verified assessments that investors can evaluate it against their risk criteria and make a funding decision. Sounds simple and straightforward. It is not.
The development stage framework, as outlined by the World Bank (2024c) and African Development Bank (2024), distinguishes five phases:
Identification: Project concept identified
Preparation: Feasibility studies, preliminary design
Bankability: Investment-grade documentation complete
Financial Close: Funding secured, agreements executed
Implementation: Construction and operation
To reach bankability, a project must survive what I’ve started calling “the gauntlet.” I built this cost breakdown from Boston University Global Development Policy Center data, IFC standards documentation, and McKinsey’s infrastructure analysis:
Feasibility studies. Technical assessment of the resource (solar irradiance data, hydrological records, wind measurements), demand forecasting, site assessment. Duration: 6-18 months. Cost: $30,000-$80,000 for consultant fees, fieldwork, and modeling. Total Cost: $50,000-$500,000 depending on project scale and location (Boston University Global Development Policy Center, 2024).
Environmental and social impact assessments. Required by law in every African country. This means environmental baselines, community engagement (often 50-100+ hours of public consultation), social risk screening, ESG compliance documentation. Duration: 3-9 months. Cost: $20,000-$150,000 depending on complexity. Requires extensive stakeholder consultation, sometimes 50-100+ hours of public engagement (IFC, 2024).
Preliminary engineering design. Technical specifications sufficient for investors to assess construction risk and cost. Duration: 3-6 months. Cost: $50,000-$200,000.
Financial modeling and business planning. Pro forma development, sensitivity analysis, debt/equity structuring, investor materials. Duration: 2-6 months. Cost: $20,000-$300,000.
Legal and regulatory documentation. Land rights verification, permit applications, utility coordination, regulatory filings. Duration: 3-12 months depending on jurisdiction. Cost: $15,000-$200,000 in legal fees.
Add it all up: $150,000 to over $1 million per project, 18-36 months of work, before anyone evaluates whether to write a check for actual construction.
And here’s the critical point: these costs must be paid by the developer upfront, with no guarantee of success. If the project fails to reach financial close (which the vast majority do), that preparation capital is simply gone.
“No bankable projects” starts to sound less like a diagnosis and more like saying “nobody survives the obstacle course we designed.”
The Valley of Death Is Wider Than You Think
McKinsey did an analysis of African infrastructure projects back in 2020, and one number keeps getting cited because it’s so stark:
“80% of African energy projects fail at the feasibility stage”. (McKinsey, 2020).
Eighty percent. Four out of five. Dead before they ever get to the point where “bankability” is even evaluated.
Not at financing. Not at construction. At feasibility. Dead in the gauntlet, never reaching the point where an investor says “this project doesn’t meet our criteria.” They die before anyone gets the chance to evaluate them at all.
But it gets worse.
Research from McKinsey (2020) and the African Development Bank (2024) establishes that projects distribute dramatically unevenly across development phases. Of the projects that survive feasibility, only about 10-15% reach what would be considered “bankable” status. And of those bankable projects? Only 5-10% actually reach financial close.
Let me walk you through what this funnel looks like with real numbers from the AfDB (2024):
Start with 10,000 projects identified in regional development plans across Africa. By the time you get to the preparation phase, you’re down to 2,000-3,000 (20-30% survive initial identification). Of those, maybe 200-300 reach what would be considered “bankable” status (85-90% attrition during preparation and verification). And projects that actually close financing each year? 20-50.
The conversion rate from “identified” to “funded” is something like 0.2-0.5%.
This means that 85-93% of projects entering preparation phase never reach bankability (McKinsey, 2020; AfDB, 2024).
As the research notes, this “contradicts a ‘capital constraint’ hypothesis; if capital were the binding constraint, bankable (investment-grade) projects should close at substantially higher rates” (World Bank, 2024c).
The conversion rate from “identified” to “funded” is something like 0.2-0.5%.
This isn’t a bankability problem. This is a system designed to produce failure.
I compared this to OECD markets using the same methodology:
Projects entering preparation: 80-90% closure rate
Average timeline: 18-24 months
Transaction costs: 0.2-0.4% of project value
Same technology. Same fundamental economics (often better in Africa, given higher solar irradiance and unmet demand). Yet the conversion rate is 3-8x worse and timelines are 100-200% longer.
The difference isn’t project quality. The difference is everything around the projects.
The Trust Infrastructure Deficit
So what’s actually happening in that 80% failure zone?
After digging through the research, I’ve started thinking about it as a “trust infrastructure deficit” (World Bank, 2024c). Not capital. Not technology. Not even political will. But the absence of systems that allow projects to be efficiently evaluated, verified, and coordinated across the web of stakeholders involved.
The thesis is straightforward: “Energy infrastructure markets suffer from what we term ‘trust infrastructure deficit’—the absence of standardized, verifiable data systems that enable efficient project evaluation, risk assessment, and stakeholder coordination. This deficit creates repeated manual work across stakeholder groups, context mismatches in project documentation, and inability to verify investment-critical information” (World Bank, 2024c).
Three Execution Bottlenecks
After months of analysis, I’ve identified three distinct, quantifiable friction points that kill projects before they ever reach bankability evaluation. I’m calling them preparation friction, verification redundancy, and coordination chaos.
Bottleneck 1: Preparation Friction
The gauntlet I described above isn’t just expensive. It’s expensive upfront, with no reimbursement if you fail.
This creates what I’m calling an “experience barrier.” Well-capitalized developers (often foreign, often with decades of track record) can self-finance the $150,000-$1 million required to prove a project concept. Local developers cannot. Mid-tier developers cannot.
The result: market concentration, reduced competition, higher costs for end-users. This isn't a meritocracy where the best projects win.
And then someone at a conference says “there are no bankable projects” and everyone nods.
How constrained is preparation capacity? I mapped the Project Preparation Facility landscape across the SADC region. What I found is brutal.
The SADC region (16 countries, over 300 million people) has exactly 3 Project Preparation Facilities. Their combined annual capacity is approximately $50-100 million supporting 250-300 projects. Annual demand? I estimate $2-5 billion across 1,500-3,000 projects based on pipeline data (World Bank, 2024c; AfDB, 2024).
That’s a 50x capacity gap between what developers need and what exists to help them.
The Boston University Global Development Policy Center put it bluntly in their 2024 analysis: “The SADC region does not have a project preparation facility dedicated for renewable energy and/or energy efficiency. This means that renewable energy projects must compete with other energy subsectors such as transmission, or other infrastructure sectors.”
Three facilities. Sixteen countries. 50x gap.
Bottleneck 2: Verification Redundancy
Even when projects reach bankability, they face a verification gauntlet that is pure institutional failure.
Here’s how it works. A typical African energy project seeking financing involves multiple stakeholders: the developer, one or more DFIs (World Bank, AfDB), bilateral partners, insurance providers, the utility/off-taker. Each of these stakeholders independently verifies the same technical and financial data using different consultants and different methodologies.
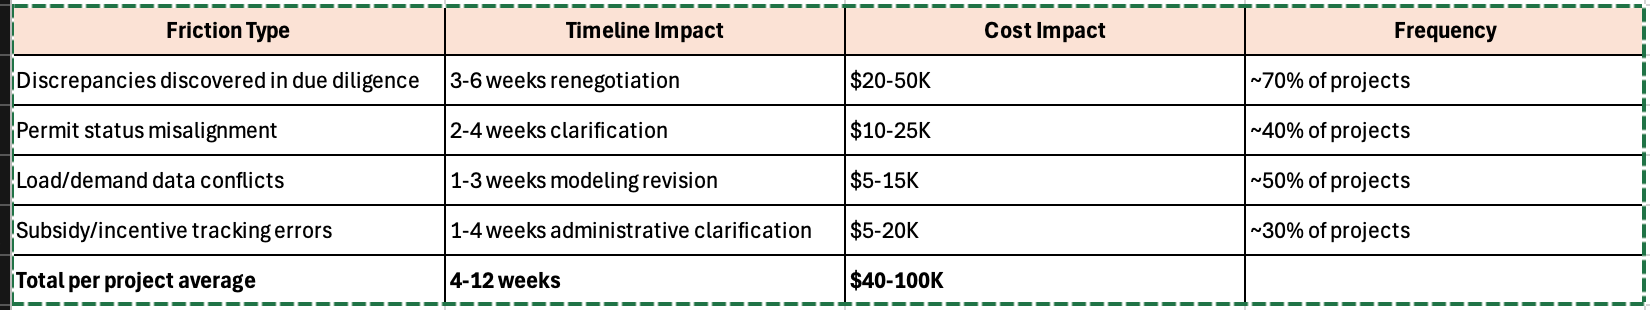
I mapped the typical cost structure for a single project:
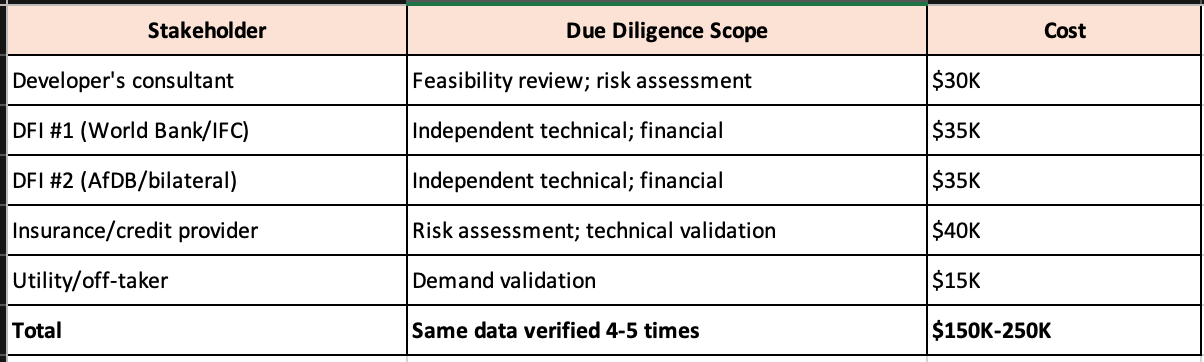
The same solar irradiance data. The same hydrology. The same load profiles. Validated independently by 4-5 parties using different consultants and different methodologies. Producing data conflicts that require 3-8 weeks of renegotiation (according to McKinsey, 2020). Inflating costs through repeated hiring. Creating investor friction when due diligence results conflict.
I calculated the aggregate waste across the African energy project pipeline: $10-31 million annually for projects in active due diligence. For complex projects that see 5-7 verification cycles (due to funder changes, political shifts, market conditions), the waste pushes to $30-50 million annually.
This is not a knowledge problem. We know what due diligence is needed. This is an institutional coordination failure.
The GEAPP/RMI Nigeria Interconnected Minigrid pilots demonstrated this vividly. Each of the 4 pilot projects went through independent due diligence from REA, the relevant Disco, World Bank, and the private developer. Verification timelines stretched to 8-14 months (versus 3-4 months in OECD markets). Conflicting technical assessments led to 6-12 week renegotiations per project. Total project timeline inflation: 24-36 months versus 18-24 months with unified due diligence.
Bottleneck 3: Coordination Chaos
Project information typically sits scattered across 5-10 systems with no integration. I mapped the typical stakeholder landscape:
The developer’s system holds project data, financials, technical specs. The utility/distribution company has load data, grid interface requirements, operations plans. Government databases track permits, land rights, environmental clearance, subsidy/incentive status. Lender files contain due diligence results, covenants, monitoring requirements. Insurance providers maintain underwriting data and coverage terms. Regulators track tariff approval, license status, compliance. Bilateral development partners run their own project tracking and results monitoring. And sometimes multiple DFIs operate overlapping systems with conflicting requirements.
None of these systems talk to each other. Updates don’t propagate. There’s no authoritative data source.
I quantified the friction from McKinsey’s 2013 infrastructure project analysis and World Bank pipeline data:
Across 300-400 projects in active development, this coordination chaos creates 1,200-4,800 person-weeks of delay annually and $12-40 million in direct reconciliation costs, plus another $20-60 million in finance costs from extended timelines.
This Isn’t Just an African Problem
Before anyone dismisses this as “African dysfunction,” let me show you what I found when I looked at global comparisons.
Northern Virginia hosts approximately 70% of global hyperscale data center capacity. The companies building there (Amazon, Google, Microsoft) have access to effectively unlimited capital. Annual grid investment runs $500 million to $1 billion. Technology is proven. Demand is certain.
Yet grid connection wait times have expanded from 2-3 years (2018-2020) to 7-10 years (2024-2025) as AI-driven demand growth (11-13% CAGR) outpaced infrastructure execution capacity.
The IEA’s 2024 analysis found that 20% of planned global data center projects face delays due to grid constraints, not financing. Goldman Sachs projects that every planned expansion is delayed 2-4 years on average.
Even with infinite capital and proven technology, execution capacity determines deployment speed. This is not an African problem. It’s a global infrastructure system problem exposed by rapid demand growth.
Africa’s challenge is the same constraint, with weaker baseline infrastructure to absorb the friction.
What’s different is the infrastructure for execution. The research identifies five factors that make developed markets faster (McKinsey, 2020):
Standardized documentation (familiar legal structures reduce renegotiation)
Established verification protocols (data standards reduce re-verification)
Experienced lenders (internal risk models reduce analysis time)
Mature supply chains (contractor capability readily assessed)
Stable regulatory environments (permitting timelines predictable)
“Africa lacks all five elements, accumulating friction” (McKinsey, 2020).
The Proof That It Can Be Different
Several African energy projects have achieved OECD-like development timelines. The research documents what made them different (World Bank, 2024c):
Tina River Hydropower Project (Solomon Islands):
Timeline: 30 months from identified to financial close (near OECD range)
Intervention: World Bank/IFC project preparation intensive support
Cost: $15M in preparation support
Result: $200M project financed; 1.33x return on preparation investment
Key success factor: “IFC provided project preparation, transaction advisory, and structured financing partnerships; single coordinating entity eliminated context mismatch”
Lake Turkana Wind Project (Kenya):
Timeline: 48 months (longer than OECD but faster than African median)
Intervention: Long-term partnerships with European development finance institutions; standardized project documentation
Key success factors: Experienced developer; dedicated DFI partnership; standardized risk structures
The research draws a clear lesson: “When preparation capacity and coordination infrastructure are provided, execution friction declines materially. This supports the thesis that friction, not capital or technology, is binding” (World Bank, 2024c).
The World Bank’s Own Data
Here's what convinced me this is solvable: we already have evidence of what works.
The World Bank's Project Preparation Facility has been quietly demonstrating extraordinary returns for years. Their experience provides what the research calls “controlled evidence of execution friction reduction” (World Bank, 2024c):
PPF Impact Metrics:
Projects receiving PPF support: 150+ annually across Africa
Closure rate post-PPF: 45-55% (vs. 5-10% baseline)
Timeline reduction: 12-18 months faster to close
Average PPF cost: $200K per project
Average project value: $80-150M
Cost-benefit: PPF cost of 0.13-0.25% of project value
Return on Preparation Investment: The research calculates: “If PPF enables 40% of projects to close that wouldn’t otherwise, and prevents 12-month timeline extension (8% interest cost), return on $200K investment: $3.2M-$12M per project. Payback: 3-6 months” (World Bank, 2024c).
This is an extraordinary return. As the research states: “This extraordinary return on preparation investment demonstrates that execution friction elimination is massively value-creating—more lucrative than most operational improvements to existing projects” (World Bank, 2024c).
So why isn’t there more of this?
What Would Actually Help
I don’t want to be the person who diagnoses a problem without at least gesturing at solutions. The research outlines what it calls “trust infrastructure,” with five interconnected components (World Bank, 2024c; Spherity, 2025):
1. Data standardization. Common frameworks for resource assessment validation (ISO 9060 for solar radiation, IEC 61400-12 for wind), financial modeling conventions (WACC calculations, cost structures), and legal document templates (IFC PPA templates, FIDIC contracts, World Bank standard terms).
Estimated impact: “Standardization could reduce due diligence timelines 30-40% and costs 20-30%, saving $70K-$150K per project ($21-45M annually across African pipeline)” (World Bank, 2024c).
2. Verification credentialing. Third-party validation systems that investors can trust. Certification processes for data collection equipment and methodology. Performance tracking for consultants comparing forecasts to actual results. Public registries of qualified providers.
Estimated impact: “Trust infrastructure could reduce verification costs 40-60% and timelines 25-35%, saving $120K-$180K per project ($36-54M annually)” (World Bank, 2024c).
3. Coordination platforms. Integrated project information systems maintaining single authoritative versions of project data, with role-based access for different stakeholders and automatic flagging when documents diverge.
Estimated impact: “Such systems would reduce coordination friction 25-40%, saving 4-10 weeks per project ($40K-$100K per project; $12-30M annually)” (World Bank, 2024c).
4. Risk assessment and pricing infrastructure. Standardized risk taxonomies, historical frequency and impact data, pricing models, and pre-negotiated insurance products.
Estimated impact: “Reduces cost of capital by 200-500 bps through more accurate risk assessment; enables smaller projects to be financed” (World Bank, 2024c).
5. Project preparation facilities at scale. Not 3 regional facilities for 16 countries. Something like 20-30 facilities with combined capacity of $2-5 billion annually.
The Return on Investment
The research aggregates the impacts (World Bank, 2024c):
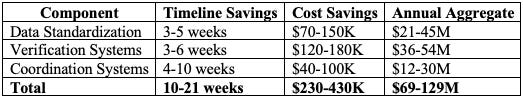
The total cost for comprehensive trust infrastructure? The research estimates $70-100 million over six years (World Bank, 2024c).
The value created once operational? $500 million to $1 billion annually through transaction cost reduction, timeline improvement, and reduced cost of capital (World Bank, 2024c).
That’s a 5-15x return. As the research concludes: “$1 invested in execution infrastructure enables $5-10 in capital deployment” (World Bank, 2024c).
The Industry Knows This
I’m not the only one who sees this. The Minigrid CEO Coalition (AMDA, Husk Power, ANKA, Ashipa etc) released an industry position paper on January 26, 2026. Their 17-step action plan lists “policy, regulatory and performance standardisation” as a critical bottleneck. They’ve expressed willingness to co-fund solutions with $5-10 million in private sector co-investment.
The people actually deploying projects understand the real constraint. It’s the people evaluating projects from a distance who keep citing “bankability.”
Why This Framing Matters
I’ve been thinking about why the “no bankable projects” narrative persists despite evidence that it’s incomplete at best.
Partly it’s convenient. If the problem is on the demand side (not enough good projects), then the solution is for Africans to “get their act together” while capital providers wait patiently. Nobody has to change how development finance works. Nobody has to invest in the unglamorous infrastructure of project preparation. Nobody has to admit that the system is structurally designed to produce failure.
Partly it’s measurement. We count capital committed. We count capital deployed. We celebrate the headline numbers at summits. We don’t count the 80% of projects that died at feasibility because there was no standardized documentation framework to help them. We don’t measure the months lost to redundant verification or the millions wasted on preparation for projects that fail due to coordination breakdown rather than fundamental unviability.
Partly it’s attribution. If a project fails to reach bankability, whose fault is it? The developer who couldn’t produce documentation? The consultant who couldn’t validate data? The lender who couldn’t assess risk efficiently? The government that couldn’t provide permits quickly? Everyone shares blame, so no one bears it. The “bankability problem” becomes a diffuse institutional failure rather than anyone’s specific responsibility.
And partly it’s just easier to believe that the market is working correctly. If good projects existed, they’d get funded. If they’re not getting funded, they must not be good enough. The invisible hand sorts it out.
Except the hand isn’t invisible. It’s friction. And friction is something we can actually reduce.
Let me be explicit: The world is spending $470 billion annually on grid infrastructure. The queues are still 4-8 years. More capital is not the answer.
The answer is execution capacity: faster permitting, standardized equipment specifications, pre-certified designs, streamlined approval workflows, coordinated stakeholder processes.
The answer, in other words, is reducing execution friction.
What I’m Uncertain About
I want to be honest about the limits of this analysis.
The 80% failure rate at feasibility comes from McKinsey’s study of approximately 500 projects. That’s a meaningful sample, but it’s not comprehensive population data. Country-specific conversion rates likely vary significantly. Kenya’s C&I market probably has better conversion than Cameroon’s regional interconnection pipeline.
The ROI estimates depend on assumptions about adoption rates, implementation timelines, and stakeholder coordination that haven’t been tested at scale. The World Bank PPF model works. Whether continental trust infrastructure scales the same way is genuinely uncertain.
And institutional constraints beyond execution friction (corruption, policy instability, macroeconomic crises) could limit results even if the infrastructure works perfectly. I’m assuming a baseline level of functional institutions. That assumption doesn’t hold everywhere.
But the weight of evidence from multiple geographic contexts, time periods, and project types points clearly in one direction: execution friction, not project quality, is the binding constraint.
The Point
Here’s where I’ve landed after months of this research:
When someone tells me “the problem is there are no bankable projects,” I now hear something different. I hear a system-level coordination failure being misdescribed as a project-quality problem. I hear an 80% feasibility-stage failure rate being attributed to developers rather than to the absence of preparation infrastructure. I hear $30-50 million in annual verification waste being ignored while investors complain about project documentation.
Capital is not the binding constraint. $30-90 billion committed, $7.9 billion deployed. The constraint is demonstrably looser than capital.
Technology is not the binding constraint. Solar and wind have reached cost parity. Minigrid designs are mature. Battery storage is proven. Technology works.
Political will is not the binding constraint. 29 African governments have signed Mission 300 Energy Compacts with concrete targets. Regional power pools are advancing interconnection. The commitment is real.
Execution infrastructure is the binding constraint. The preparation facilities that don’t exist. The verification standards that haven’t been developed. The coordination systems that nobody built.
When execution infrastructure is provided, capital flows. Projects close. People get electricity. The World Bank PPF proves it. The solution exists. What remains is the decision to invest in it.
The absence of bankable projects is not the problem. The absence of infrastructure that enables bankability is the problem.
And that’s something we can actually fix.
All sources are public and verifiable. The synthesis and interpretation is mine. The errors, if any, are mine. The conviction that we can do better is definitely mine.
---
If you’re building in this space, or thinking about it, or just want to argue about whether I’m right: kaykluz@yahoo.com. I am particularly interested in talking to people working on standardization frameworks, verification systems, or project preparation at scale.
This is part of the Energy-Compute Deterrence series. I’ve been building this research over months, synthesizing data from 180+ sources across development finance, energy infrastructure, project management, and digital trust literature. The full thesis runs 22,000+ words with detailed country profiles, sectoral deep-dives, and financial models. If you want the complete analysis or want to discuss implementation, reach out @ kaykluz@yahoo.com.
#EnergyAccess #ClimateFinance #DevelopmentFinance #Infrastructure #Africa #RenewableEnergy #Mission300 #Minigrids #ProjectFinance #ImpactInvesting
References
African Development Bank. (2024). African Energy Outlook 2024. AfDB, Abidjan.
Boston University Global Development Policy Center. (2024). Funding Feasibility: Expanding Renewable Energy and Energy Access in the SADC Region with Regional Prefeasibility Facilities. Boston University, Boston.
Climate Policy Initiative. (2024). Landscape of Climate Finance in Africa 2024. CPI, London.
Goldman Sachs Economics Research. (2025). AI to Drive 165% Increase in Data Center Power Demand by 2030. Goldman Sachs, New York.
International Energy Agency. (2022). Africa Energy Outlook 2022. IEA, Paris.
International Energy Agency. (2024a). Financing Electricity Access in Africa. IEA, Paris.
International Energy Agency. (2024b). World Energy Investment 2024. IEA, Paris.
International Energy Agency. (2025). Energy and AI: World Energy Outlook Special Report. IEA, Paris.
International Finance Corporation. (2024). IFC Performance Standards on Environmental and Social Sustainability. IFC, Washington DC.
International Renewable Energy Agency. (2024). Renewable Energy Market in Africa. IRENA, Abu Dhabi.
McKinsey & Company. (2013). A Risk-Management Approach to a Successful Infrastructure Project. McKinsey, New York.
McKinsey & Company. (2015). Infrastructure Productivity: How to Save $1 Trillion a Year. McKinsey Global Institute, New York.
McKinsey & Company. (2020). Solving Africa’s Infrastructure Paradox. McKinsey, New York.
OECD. (2023). Financing Clean Energy in Africa. OECD, Paris.
Spherity. (2025). Qualified Verifiable Data Registries (qVDR) as the Foundational Component of Digital Public Infrastructure. Spherity, Berlin.
United Nations. (2023). World Population Prospects 2023. UN Department of Economic and Social Affairs, New York.
World Bank Group. (2024a). Mission 300: Powering Africa Initiative. World Bank, Washington DC.
World Bank Group. (2024b). Poverty and Shared Prosperity 2024. World Bank, Washington DC.
World Bank Group. (2024c). Sustainable Infrastructure Finance Overview. World Bank, Washington DC.
World Bank Group. (2025). Energy Access Database. World Bank, Washington DC.
World Economic Forum. (2025). Investing in Energy Infrastructure to Boost the Transition. WEF, Geneva.
The Numbers Behind the Analysis
For those who want to verify the claims, here are the primary sources:
- IEA “Financing Electricity Access in Africa” (October 2024): $15B annual need, $2.5B deployed
- World Bank Mission 300 Initiative: $30-90B commitment range, $7.9B deployed as of Sept 2024
- IEA “Africa Energy Outlook 2022”: 666M without electricity access
**Project Failure Rates:**
- McKinsey “Solving Africa’s Infrastructure Paradox” (2020): 80% failure at feasibility
- African Development Bank project pipeline analysis: 10-15% conversion to bankability
- McKinsey “Risk-Management Approach to Successful Infrastructure” (2013): Due diligence and coordination timelines
- Boston University Global Development Policy Center “Funding Feasibility” (2024): 3 regional PPFs, $50-100M capacity vs. $2-5B demand
- World Bank PPF impact data: 45-55% closure rate, $200K investment per project, 12-18 month timeline reduction
- Goldman Sachs “AI to Drive 165% Increase in Data Center Power Demand” (2025)
- IEA “World Energy Investment 2024”: $2T annual investment, grid bottlenecks
- CSIS “Electricity Supply Bottleneck on US AI Dominance” (2025): 7-10 year Northern Virginia queues
- BloombergNEF: $470B global grid investment 2025
- Transaction costs and timelines: McKinsey infrastructure studies, NREL renewable energy project finance analysis
- Trust infrastructure framework: Spherity qVDR, W3C Verifiable Credentials, Icebreaker One Open Energy Trust Framework
- Estimated savings: Author calculations based on project-level data from multiple sources
- OECD vs. Africa project metrics: McKinsey, OECD infrastructure financing reports, IEA regional comparisons