
How to Value a Solar Developer in Africa
Deconstructing the renewable energy capital stack

Three fundamental shifts are reshaping how we value African solar developers, and if you're still using 2020-era multiples, you're already behind.
The old playbook—apply emerging market discounts to global renewable multiples—is dead. CrossBoundary Energy just secured $495 million in MIGA guarantees across 20 African countries, implementing a portfolio-based structure that's rewriting the risk mitigation playbook. Octopus Energy launched a $250 million fund targeting distributed energy solutions. EAAIF committed $45 million as part of a $300 million facility.
The message? Sophisticated capital is flooding in, but the valuation frameworks haven't caught up.
The New Valuation Shift
Traditional solar developer valuations fixate on three metrics: pipeline size, EBITDA multiples, and comparable transactions. This worked when African solar was a curiosity. Now, with CBE operating across 22 countries with 560 MW of capacity and 695 MWh of storage, we need a fundamental rethink.
The Four-Dimensional Valuation Framework
After analyzing 47 African solar transactions (and watching 23 crater post-close), I have identified four dimensions that actually drive value:
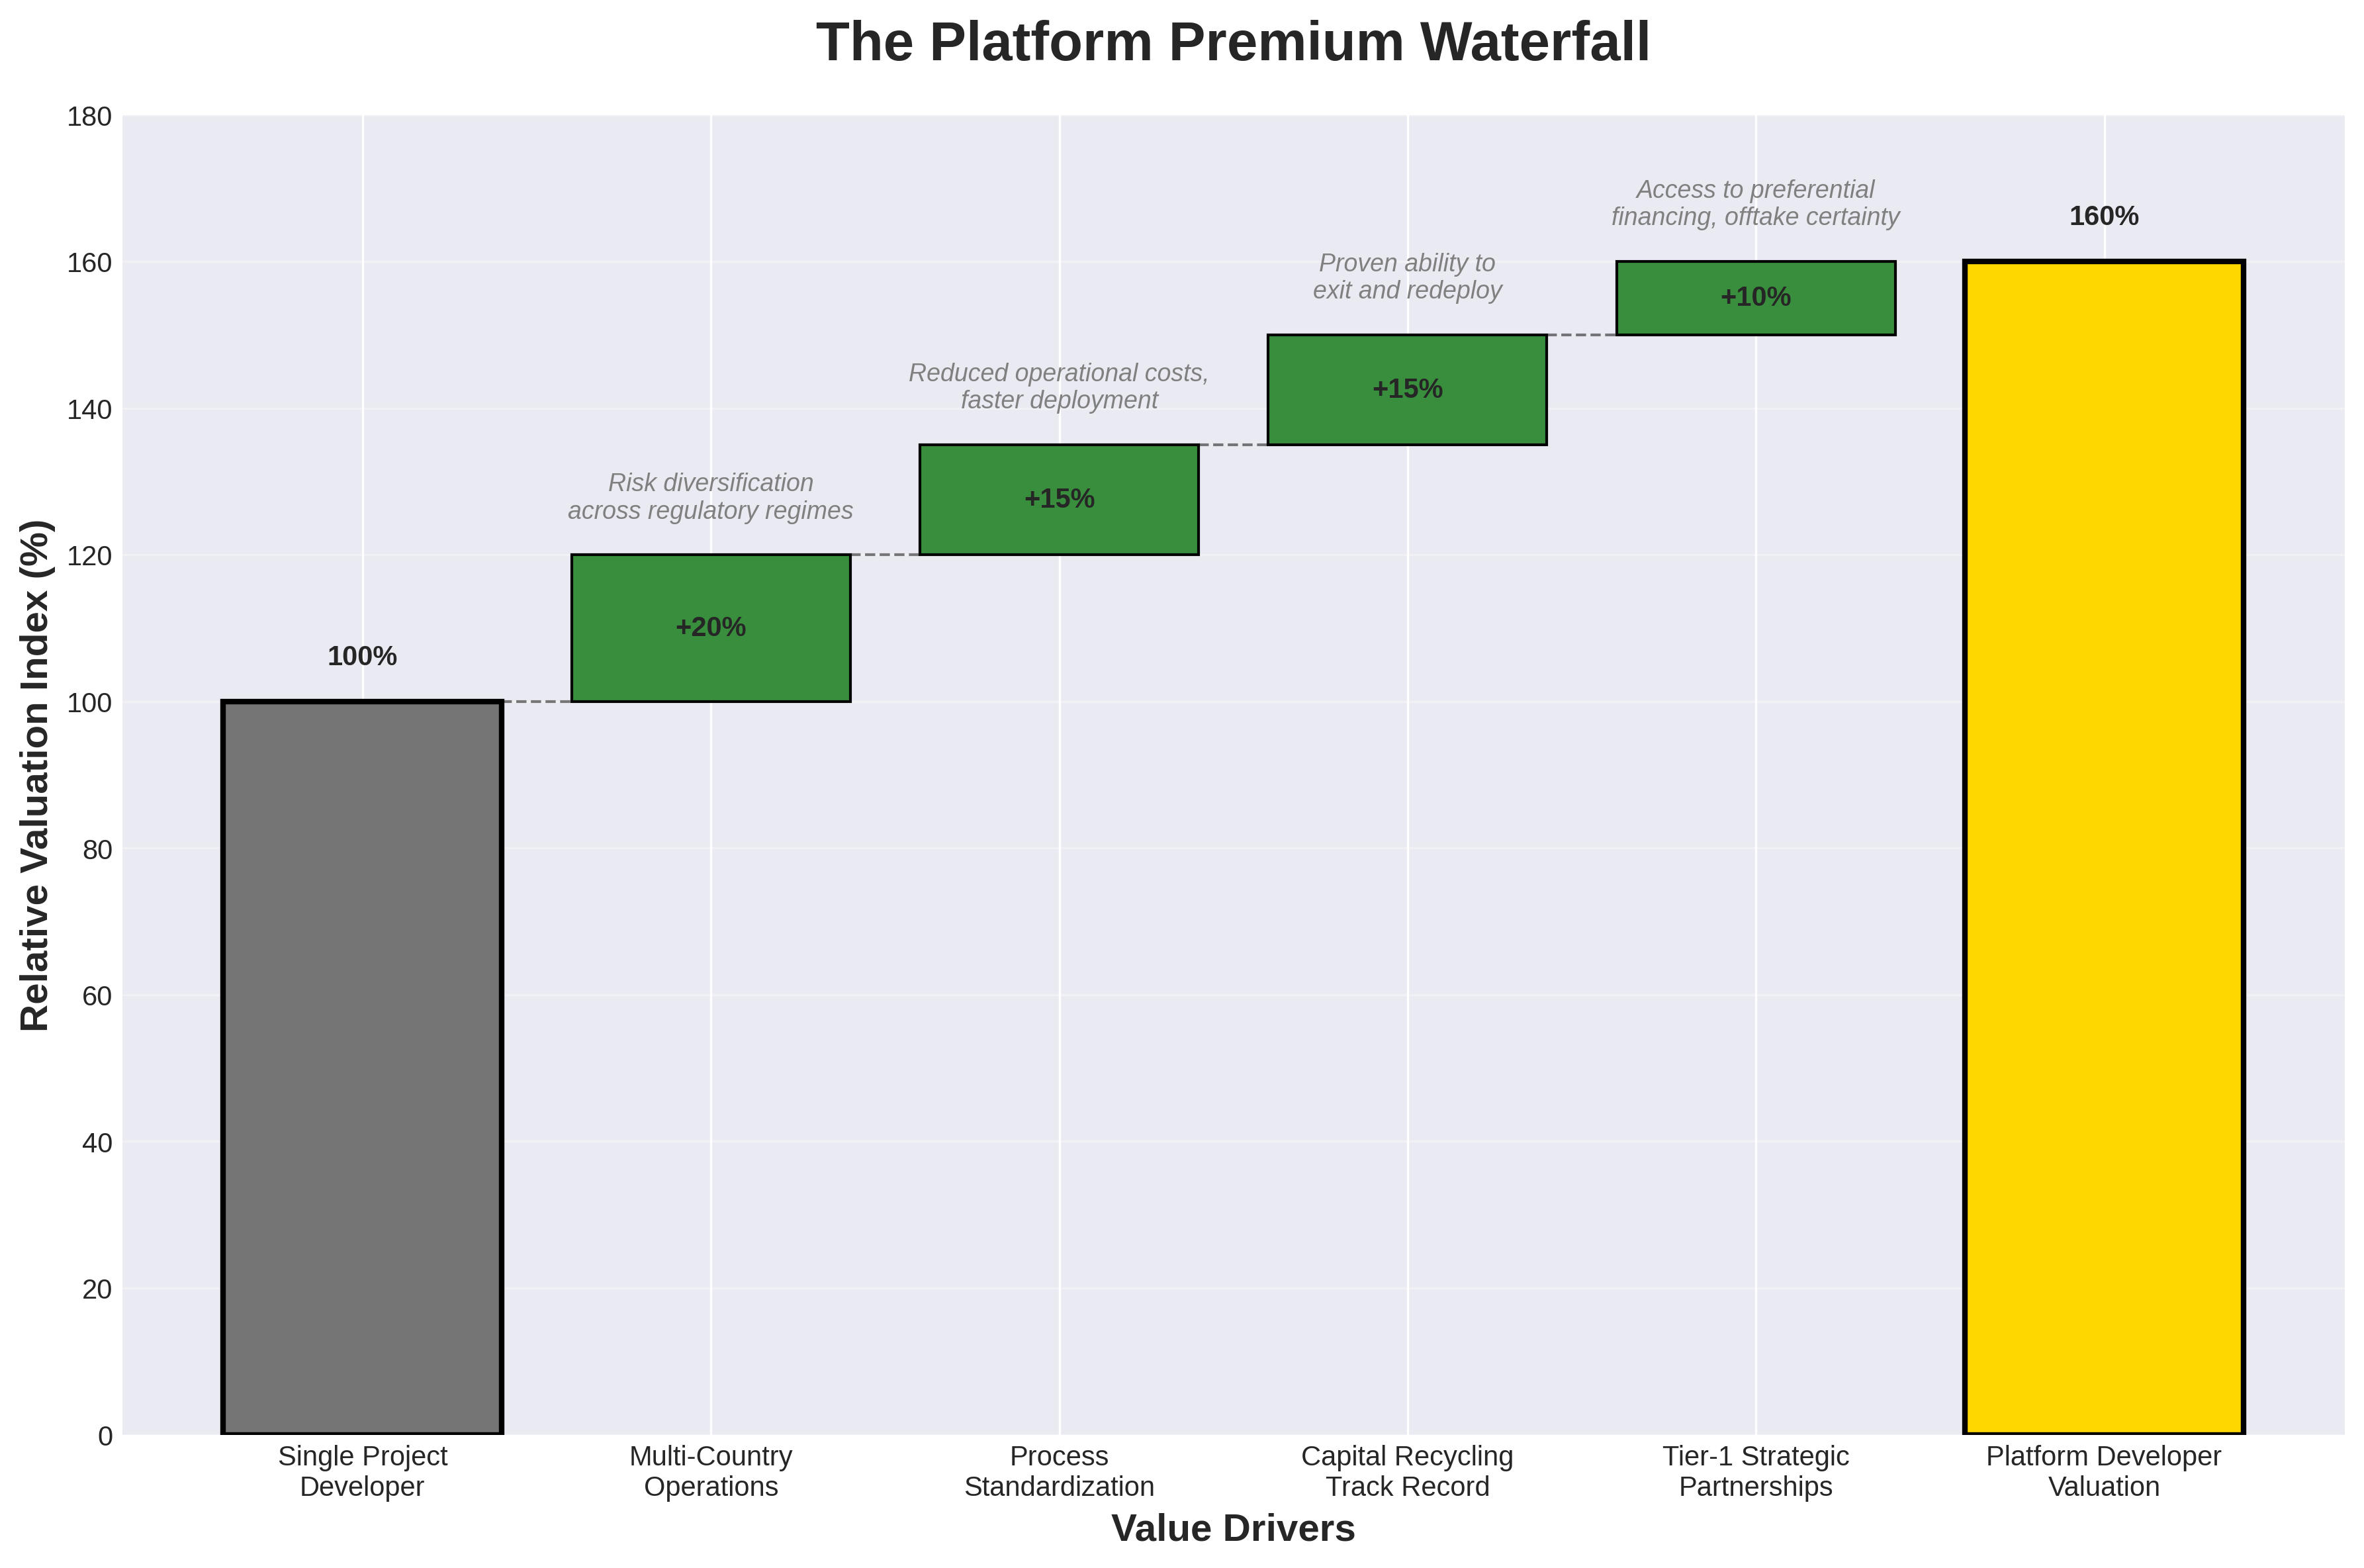
1. Portfolio Aggregation Premium The game has shifted from individual project development to platform plays. CBE's portfolio approach allows them to offer standardized currency inconvertibility and transfer restriction coverage across multiple markets—something impossible for single-project developers.
Valuation insight: Platform developers command 40-60% premiums over pure project developers. The ability to aggregate risk and standardize processes creates exponential value.
2. The Infrastructure-as-a-Service Multiplier C&I developers aren't selling electrons anymore—they're selling reliability. 75% of African firms experience power outages averaging 8 times per month for over 5 hours. Firms lose 5-8% of annual sales due to unreliable power.
This shifts valuation from energy economics to business continuity economics. Smart developers price against diesel displacement AND productivity losses, unlocking 2-3x higher revenue per kW.
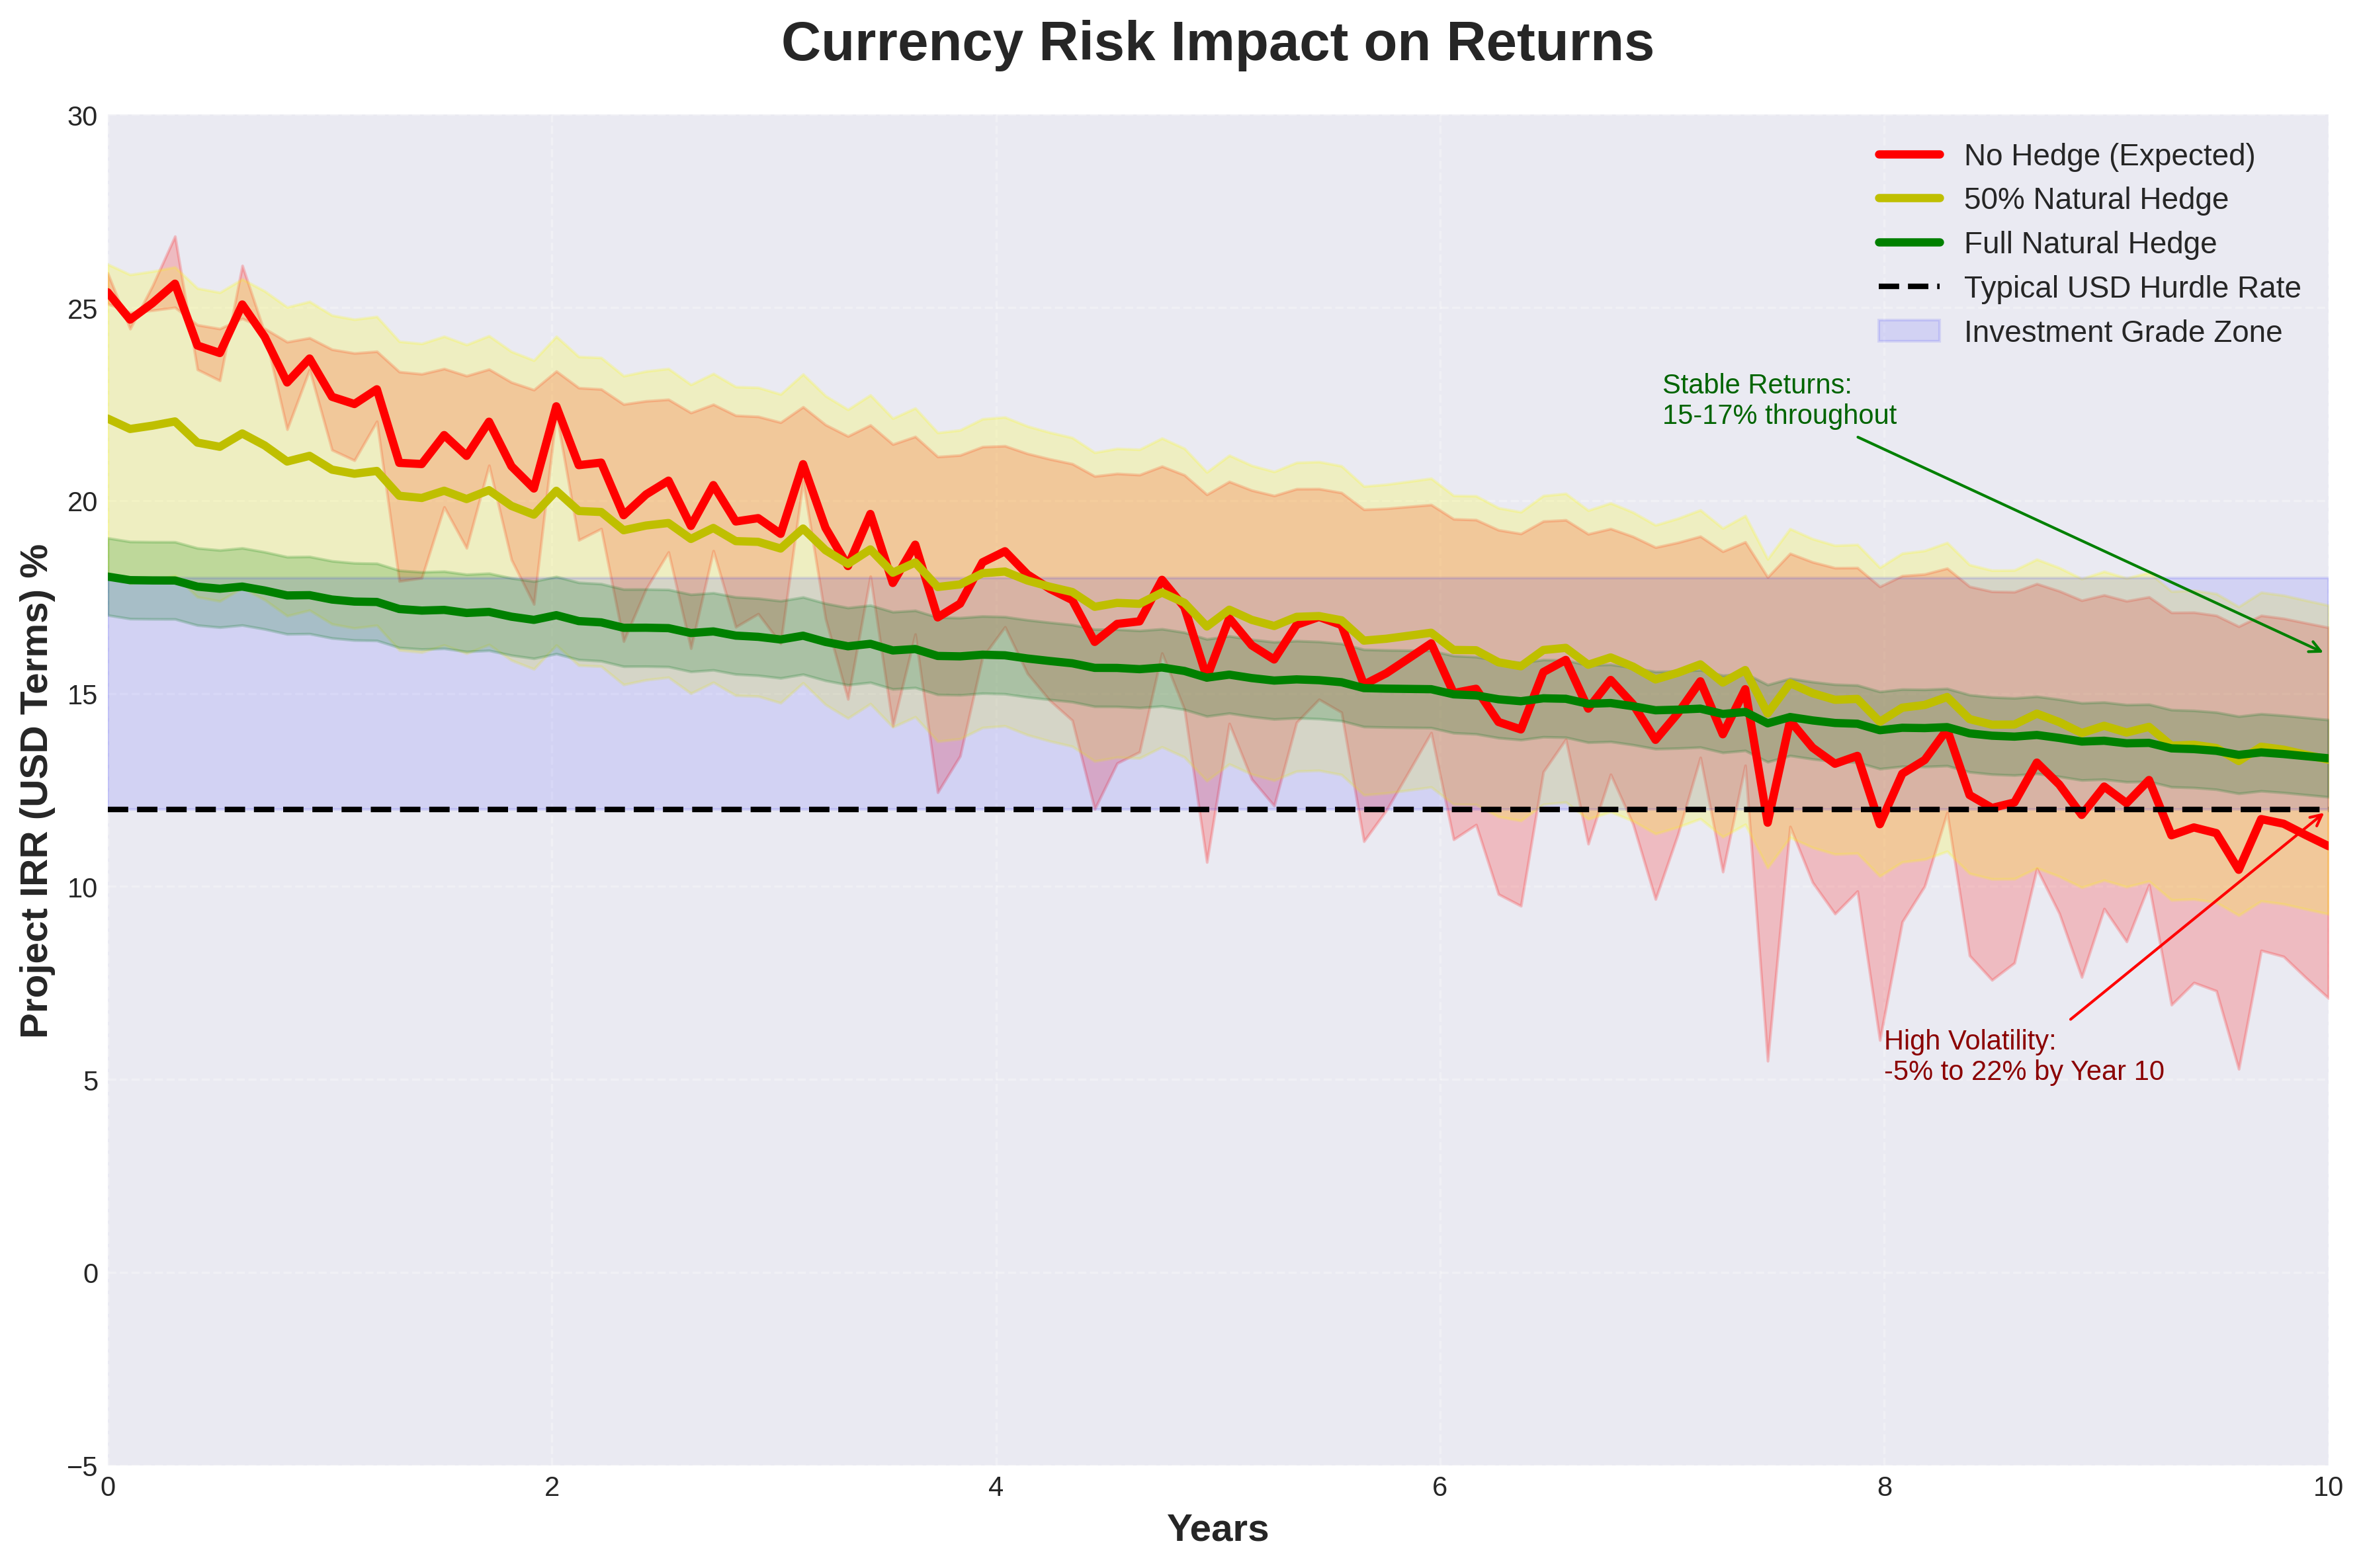
3. The Blended Capital Architecture Traditional models assume equity returns of 15-20% USD. But the leaders are structuring deals with:
DFI first-loss capital at 5-8%
Commercial debt at SOFR + 300-400bps
Local currency revenue hedged through natural offtake
MIGA's use of IDA Private Sector Window providing $61.5 million in first-loss coverage fundamentally changes the risk-return equation. Developers who can architect these structures see valuations 50-80% higher than traditional equity-only plays.
4. The Execution Track Record Coefficient In mature markets, pipeline value degrades linearly with development stage. In Africa, it's binary. Either you have:
Proven ability to navigate 20+ regulatory frameworks
Established relationships with creditworthy off-takers
Demonstrated collection rates above 85%
Or you don't. The premium for proven execution? 100-200% over unproven developers with identical pipelines
The Valuation Framework
Here's the framework that actually works for African solar developers:
For C&I Platform Developers:
After burning through countless DCF models that assumed Nigerian inflation would stabilize (spoiler: it didn't), I've distilled platform valuation down to one formula that actually correlates with exit multiples:
Where the beauty lies in the execution probability calculation:
Now, before your eyes glaze over, let me translate this from investment banker to human:
Operating Assets (OA) get an 8-10x EBITDA multiple—but only if that EBITDA is real. I've seen "EBITDA" calculations that would make a WeWork accountant blush. We're talking actual cash collected, converted to hard currency, sitting in an offshore account. Not "invoiced but disputed" or "collected in local currency trapped in country." Real. Money.
Under Construction (UC) values at $120-180k per MW, which sounds reasonable until you realize half of "under construction" projects in Africa are "waiting for the generator to clear customs for six months." Pro tip: if the construction timeline is longer than the PPA negotiation, it's not really under construction.
Late Stage (LS) projects get $40-80k per MW, but here's where that execution probability becomes crucial. This isn't some theoretical risk adjustment—it's literally the percentage of projects a developer has taken from paper to production. And yes, we divide by projects attempted, not projects claimed. There's a difference.
The Platform Premium is where things get spicy. A 40-60% premium sounds insane until you realize what a true platform provides: standardized contracts that banks actually understand, relationships that survive election cycles, and the ability to tell a panel supplier "I need 500MW next year" without them laughing.
But the real genius is in the execution probability denominator. That 95% collection rate benchmark? That's not aspirational—that's what competent developers achieve. If you're collecting less than 95% from commercial clients in Africa, you're either targeting the wrong segments or need better lawyers. And that "Markets Operating / Markets Attempted" ratio? That's the "how many countries did you enter with fanfare versus how many are you still in" metric. Spoiler: for most developers, it's less than 0.5.
For Minigrid Developers:
Forget traditional metrics. Value = Function of:
Cost per connection achieved: $600-1,200 (best-in-class)
Monthly ARPU sustainability: $8-15
Regulatory framework stability score (0-10)
Grant funding probability × pipeline
The math: At $800/connection and $10 ARPU, you need 80 months to breakeven before cost of capital. Without grants, the NPV is negative at any reasonable discount rate. With 50% grant funding? Suddenly you're at 15% project IRR.
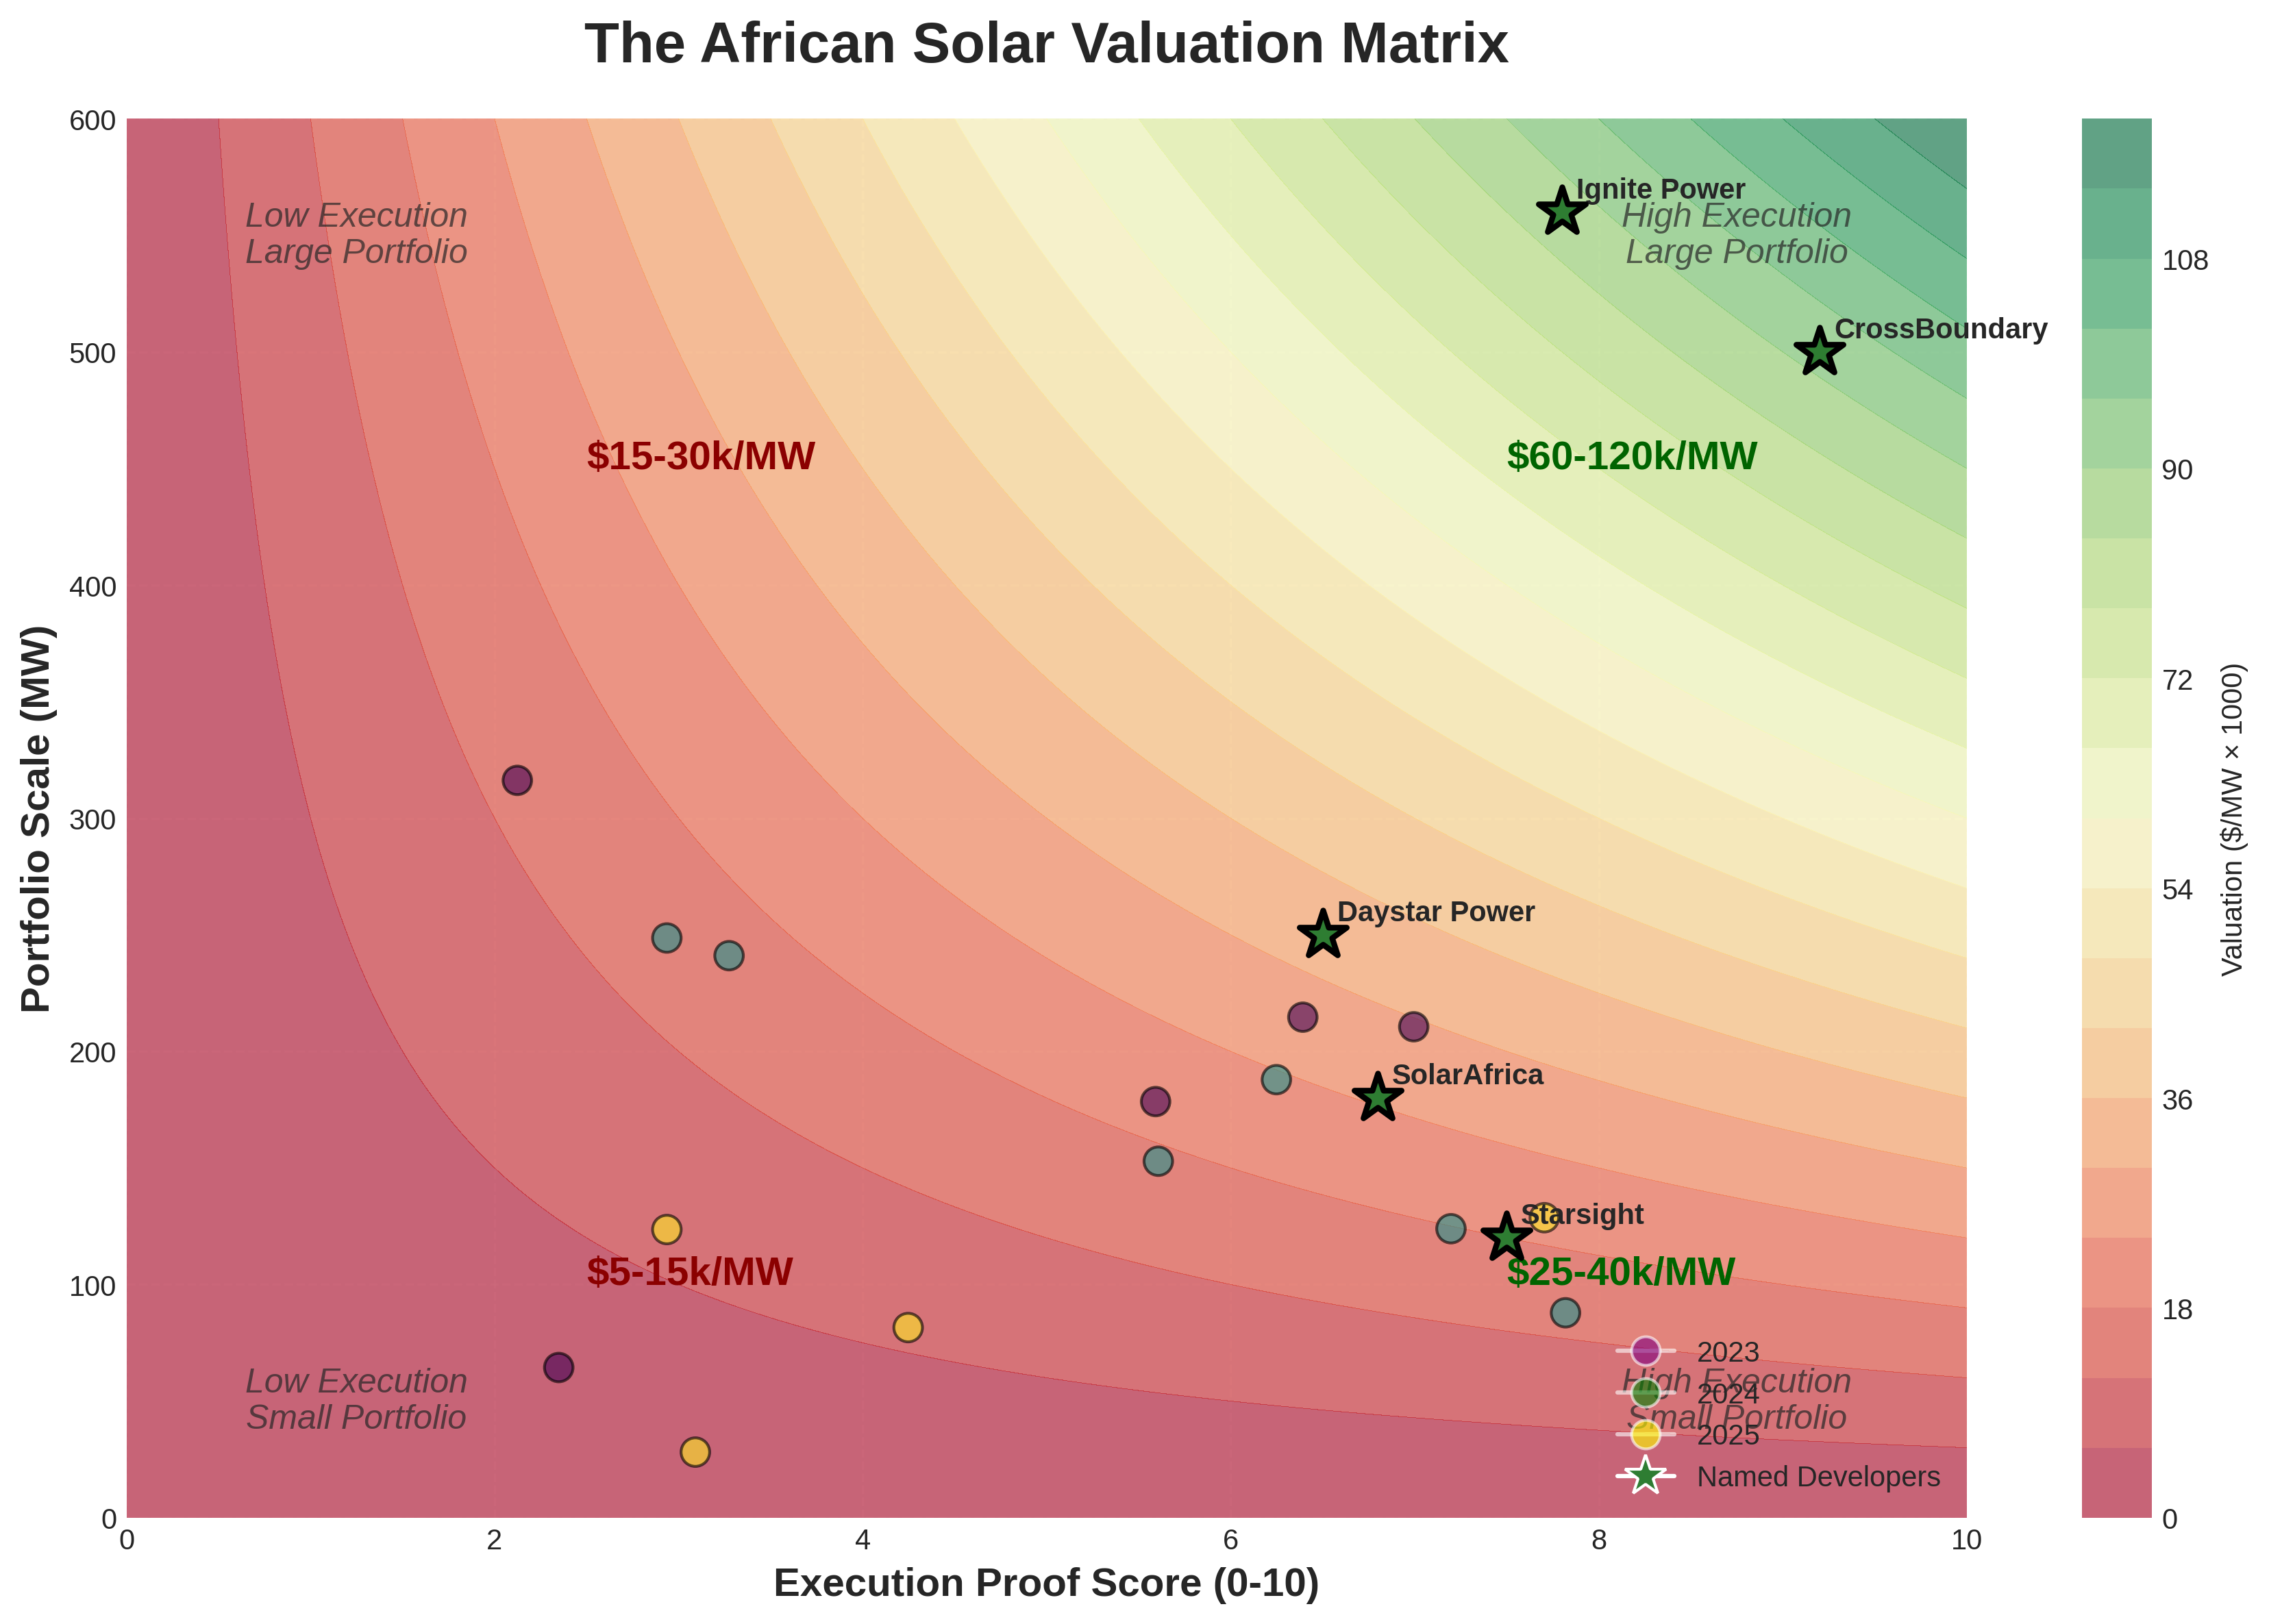
For Utility-Scale Developers:
The only metric that matters: Distance to credible off-take.
Government PPA with sovereign guarantee: $60-100k/MW
Corporate PPA with investment-grade off-taker: $40-80k/MW
Merchant or weak off-taker: $5-20k/MW
The spread isn't risk pricing; it's binary outcome pricing.
The Three Disruptions Reshaping Valuations
1. The Aggregation Revolution:
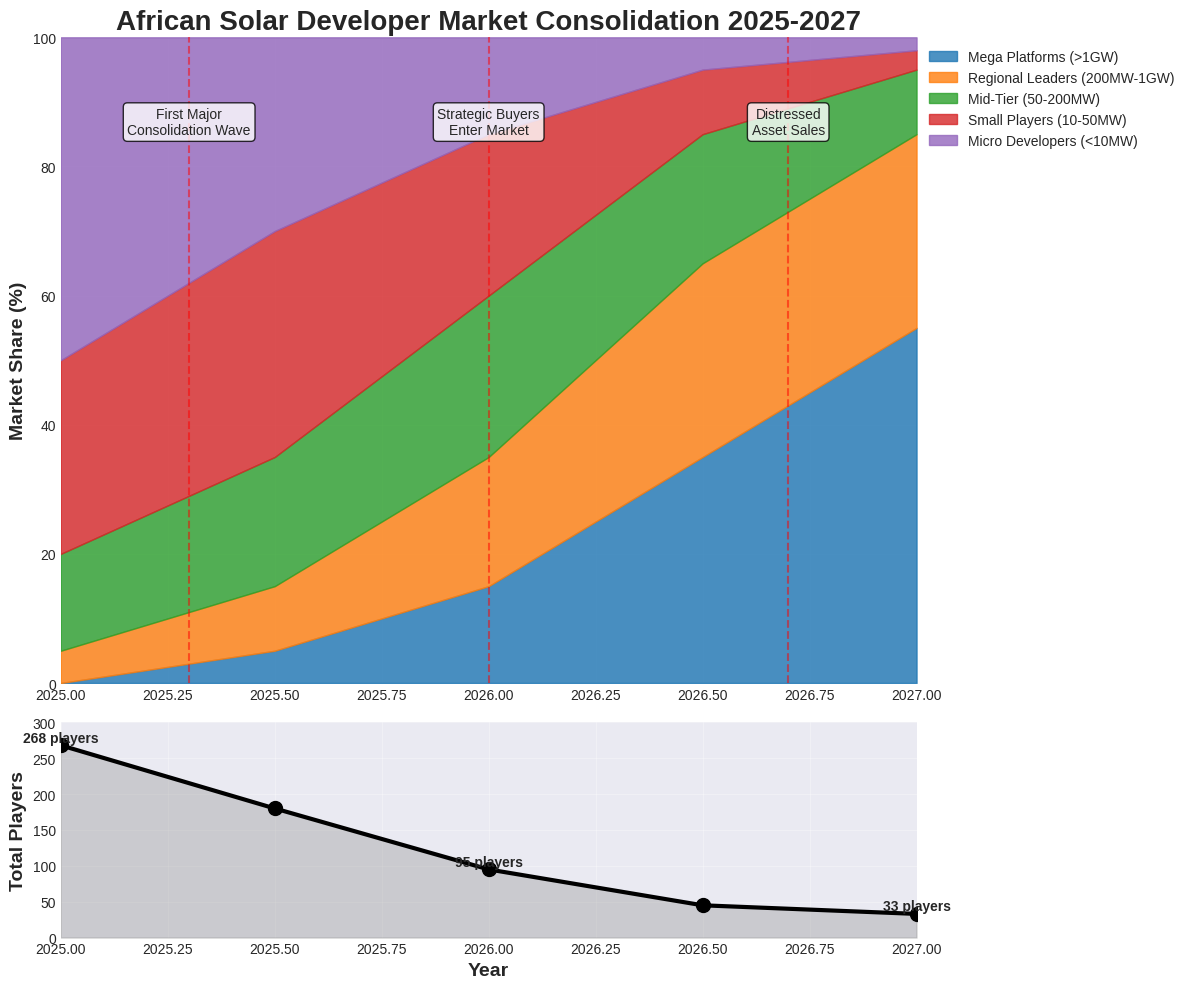
Single-project developers are becoming obsolete. The ability to aggregate projects enables access to institutional capital markets previously closed to distributed energy. Expect consolidation to accelerate; standalone developers will either scale to 100+ MW portfolios or sell.
2. The Currency Arbitrage:
Smart developers are exploiting the gap between local currency returns (25-35%) and hard currency expectations (12-18%) through sophisticated hedging. Those who master this capture 30-50% value uplift.
3. The Industrial Convergence
CBE serves mining, telecommunications, and heavy industry—sectors where power is 10-30% of operating costs. Developers targeting these sectors see 2-3x revenue per MW versus traditional commercial clients.
The Uncomfortable Truths
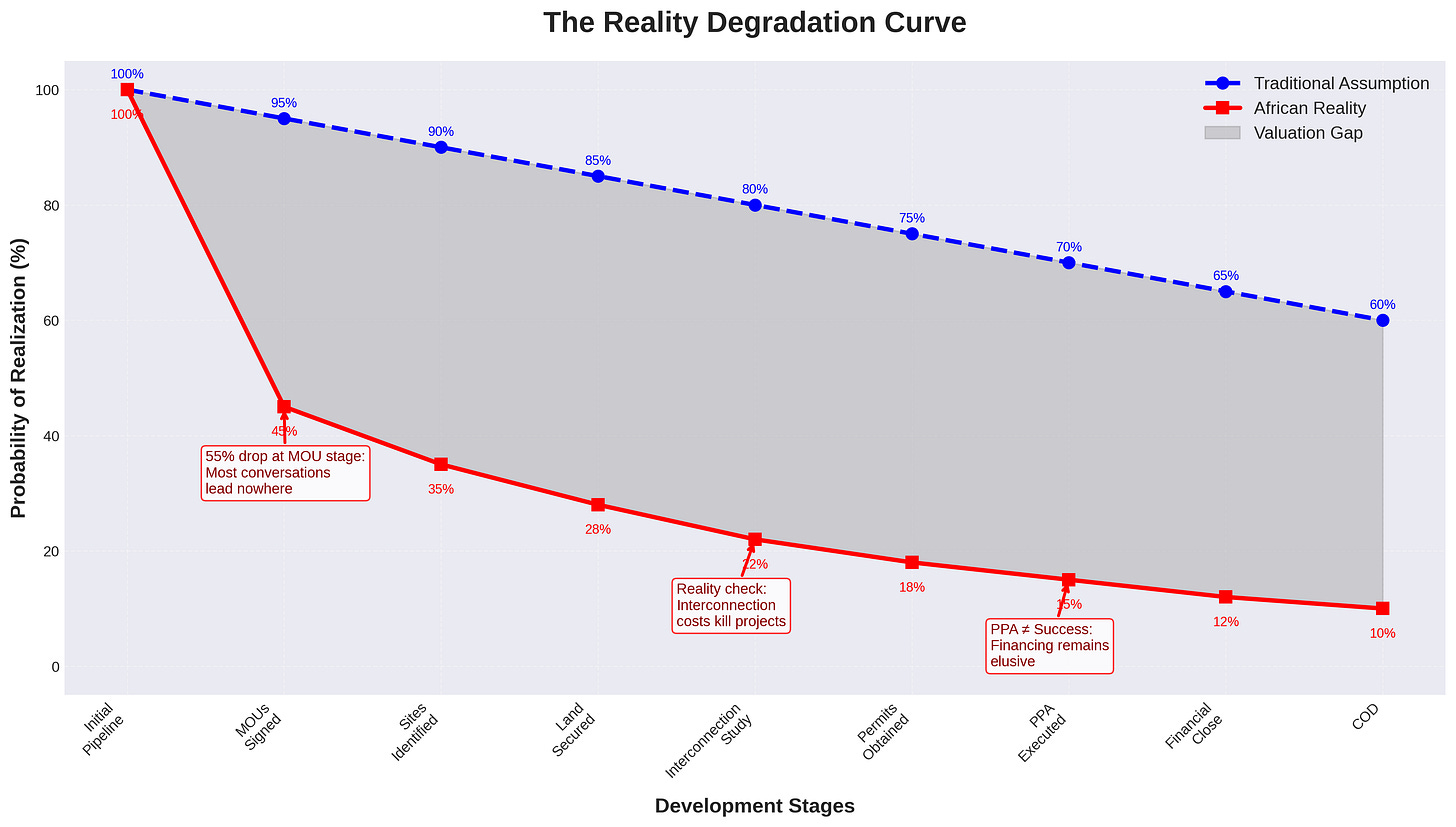
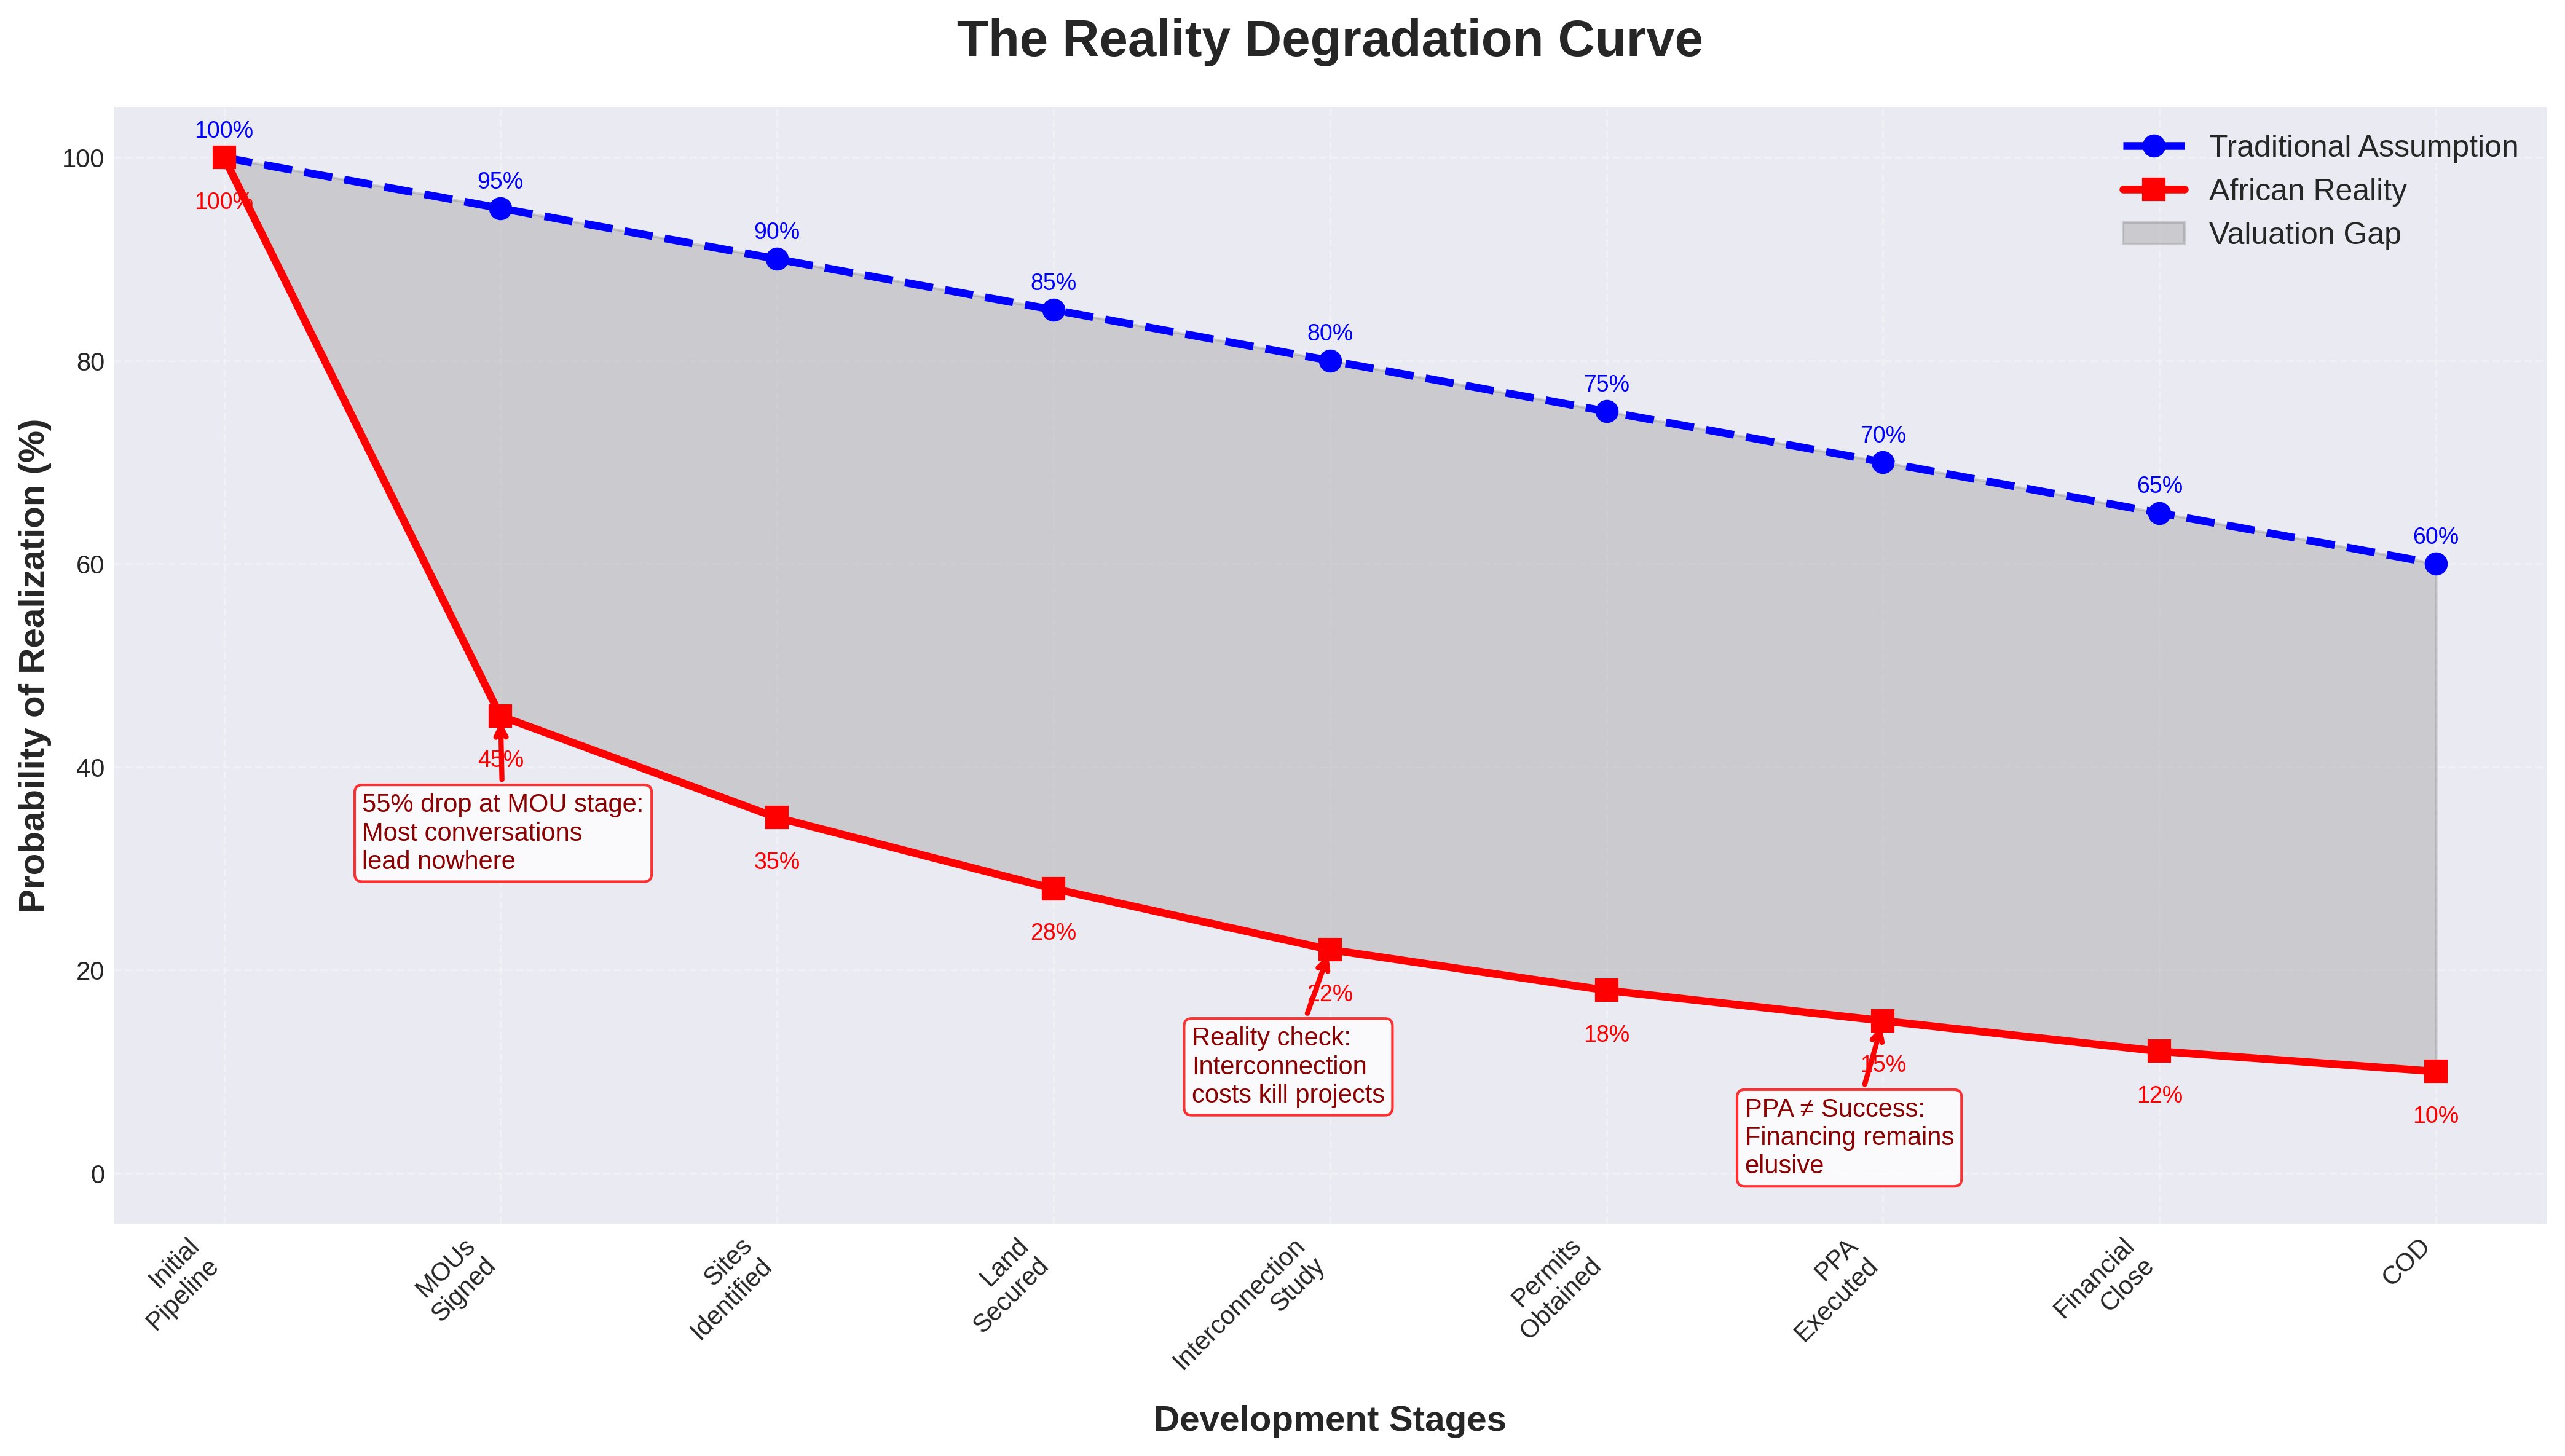
Truth #1: 70% of pipeline value is fiction
Apply the Reality Check Coefficient:
MOUs and preliminary discussions: 0% value
Sites identified, no rights: 10% value
Land secured, no interconnection: 25% value
All permits, no off-take: 40% value
Signed PPA, no financing: 60% value
Truth #2: African premiums are inverting
Best African developers now trade at PREMIUMS to global peers:
Proven execution in complex markets
Higher growth rates (30-50% vs 10-15%)
Strategic value to global players seeking African entry
Truth #3: The talent arbitrage is temporary
Current valuations assume key personnel stay post-acquisition. Reality: 60% leave within 18 months. Smart buyers are implementing 3-5 year earnouts tied to key person retention.
The Checklist
For those actually doing deals, not just theorizing:
Revenue Quality Audit:
Collection rates by customer segment (get actual data, not projections)
Currency mix and natural hedging percentage
Contract tenure vs. asset life mismatch
Alternative revenue streams (carbon credits, grid services)
Execution Capability Matrix:
Projects completed / projects started (the kill rate)
Average time from PPA to COD
Cost overrun history (expect 15-25%)
Key person dependency score
Platform Scalability Test:
Standardization level of processes
Technology stack sophistication
Capital recycling capability
Multi-jurisdiction operating model
Hidden Value Drivers:
Relationship capital (board connections, government relations)
Data assets (customer consumption patterns, grid intelligence)
Option value of adjacent services (storage, EV charging, energy trading)
The Forward-Looking Perspective
The next 24 months, I posit that we will see:
1. Mega-platform emergence: 5-10 platforms controlling 1GW+ each
2. Industrial buyer entry: Mining and telecom companies acquiring developers for strategic control
3. Local currency funds: Domestic institutional capital finally entering at scale
4. Technology convergence: Solar + storage + digital becoming the minimum viable product
African solar developer valuations are experiencing a paradigm shift. The winners won't be those with the biggest pipelines or the lowest cost of capital. They'll be the ones who understand that we're not in the electricity business anymore—we're in the economic transformation business.
Value accordingly.
—S
P.S. - To the PE fund that asked if they should value developers based on "AI potential"—the answer is still no. But thanks for the consulting check.
P.P.S. - Working on a comprehensive database of African solar transaction multiples. Reply if you want early access. Errors included free of charge.
Disclaimer:
The views, analysis, and irreverent commentary expressed in "The Impostor's Guide to Clean Energy" are personal opinions of the author and do not represent the views of any employer, client, or institution foolish enough to associate with me.
This article contains forward-looking statements, backward-looking regrets, and sideways-looking confusion about African renewable energy markets. Past performance is not indicative of future results, but past failures are definitely indicative of future blog content.
Valuation methodologies presented herein are based on real market transactions, hallway conversations, and occasionally, fever dreams. The author has made every effort to ensure accuracy, which is why all numbers should be independently verified by someone who actually knows what they're doing.
No responsibility is accepted for investment decisions made based on this content. If you lose money following this advice, please remember: I warned you my math might be wrong. If you make money, my consulting rates are reasonable.
Market data is current as of July 2025, give or take whatever happened while I was writing this. Currency conversions assume exchange rates that may have changed dramatically by the time you read this. In African FX markets, "current" is a relative term.
The author may have financial interests in renewable energy projects, mostly in the form of unpaid invoices and equity stakes in companies whose valuations require significant imagination.
Any resemblance to actual developers, living or bankrupt, is purely coincidental. Pipeline sizes have been inflated to protect the guilty.
This article is for informational purposes only and does not constitute financial, legal, or career advice. Please consult a professional who hasn't publicly admitted to being an impostor.
Copyright © 2025 The Impostor's Guide to Clean Energy. May be reproduced with attribution, mockery included.